Inference & experiments
T-Test vs. Z-Test
You have two versions of something and a number for each. But is the difference meaningful, or could it be due to chance? This article shows how to choose between a t-test and a z-test by starting with the business question, and it builds on A/B Testing, where we compared two versions and evaluated the results.
01 — Start with the Business Question
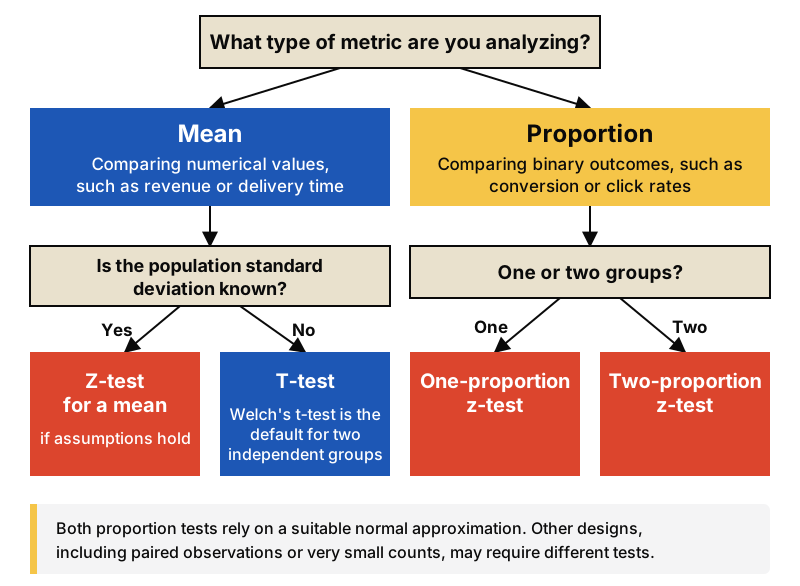
Every statistical test starts with what you want to compare. In business analytics, it is usually one of two things:
- An average, such as average order value or revenue per user.
- A proportion, such as conversion rate or click rate.
The distinction matters because averages and proportions describe different types of data and require different statistical approaches.
A mean summarizes numerical values that vary from user to user, such as the amount spent on each order.
A proportion summarizes a binary outcome, such as whether a visitor makes a purchase.
02 — Understand Why the Choice Matters
For a proportion, variability depends on the proportion itself and the sample size. This allows us to estimate its standard error directly from the data, without separately estimating a population standard deviation as we typically do when testing means.
When testing a mean, the next question is whether the population standard deviation — the true spread of values across the population — is known.
In practice, it is usually unknown, so we estimate it from the sample. This introduces additional uncertainty, which the t-distribution accounts for through its heavier tails, particularly with small samples.
As the degrees of freedom increase, the t-distribution approaches the standard normal distribution, and the difference between the two becomes negligible. A t-test is therefore generally appropriate for means whenever the population standard deviation is unknown, whatever the sample size.
A simple way to remember it
The z-test is like a detective with a clear case: the population standard deviation is known and the sample is large.
The t-test is like a detective working with less certain evidence: the population standard deviation is unknown, which is the usual case, and it matters most when the sample is small. The t-test adjusts for that uncertainty, which makes it more flexible in real-world situations.
03 — Choose the Right Test
Once you know the type of metric, one follow-up question settles the choice.
Welch's t-test
Welch's t-test compares the averages of two independent groups, such as two campaigns, without assuming that both groups have the same spread. The classic t-test combines the two standard deviations into one, which is only valid when they are equal. Welch's test keeps each group's own standard deviation and adjusts the degrees of freedom to match. When the spreads really are equal, it gives almost the same result as the classic test, which is why it is a safe default.
04 — Apply It to Business Analytics
Comparing Average Revenue
- Business question. Does Campaign B generate more average revenue per customer than Campaign A?
- Data. Campaign A: 1,000 customers, average revenue €52, standard deviation €30. Campaign B: 1,000 customers, average revenue €56, standard deviation €32.
- Test selection. The metric is an average and the population standard deviation is unknown, so use Welch's t-test for two independent groups.
- Result. t = 2.88, p ≈ 0.004.
- Interpretation. The €4 difference is statistically significant, so it is unlikely to be due to chance. Whether it is worth the extra cost is a business decision.
Comparing Conversion Rates
- Business question. Does Version B convert more visitors than Version A?
- Data. Version A converted 1,000 of 20,000 visitors (5.0%). Version B converted 1,120 of 20,000 (5.6%).
- Test selection. The metric is a proportion, so use a two-proportion z-test. The normal approximation is appropriate because both versions have large numbers of conversions and non-conversions.
- Result. z = 2.68, p ≈ 0.007.
- Interpretation. The 0.6-point lift is statistically significant, so it is unlikely to be due to chance. Whether it justifies the change is a business decision.
The numbers in both examples are illustrative.
Key takeaway
- The business question determines the test: averages and proportions call for different approaches.
- For means, a t-test is usually appropriate when the population standard deviation is unknown, and Welch's t-test is the default for two independent groups. For proportions, a z-test is commonly used when the normal approximation is appropriate.
- Statistical significance shows that a difference is unlikely to be chance. Business significance asks whether it is worth acting on.