Knowledge
Statistics is fantastic
How to read data — and make it less boring.
Data fundamentals
The basics of working with data: summarise a dataset, explore it, and structure a project from question to decision.
 Descriptive statistics
How to read the story hidden in data: center, spread and position.
 Descriptive statistics
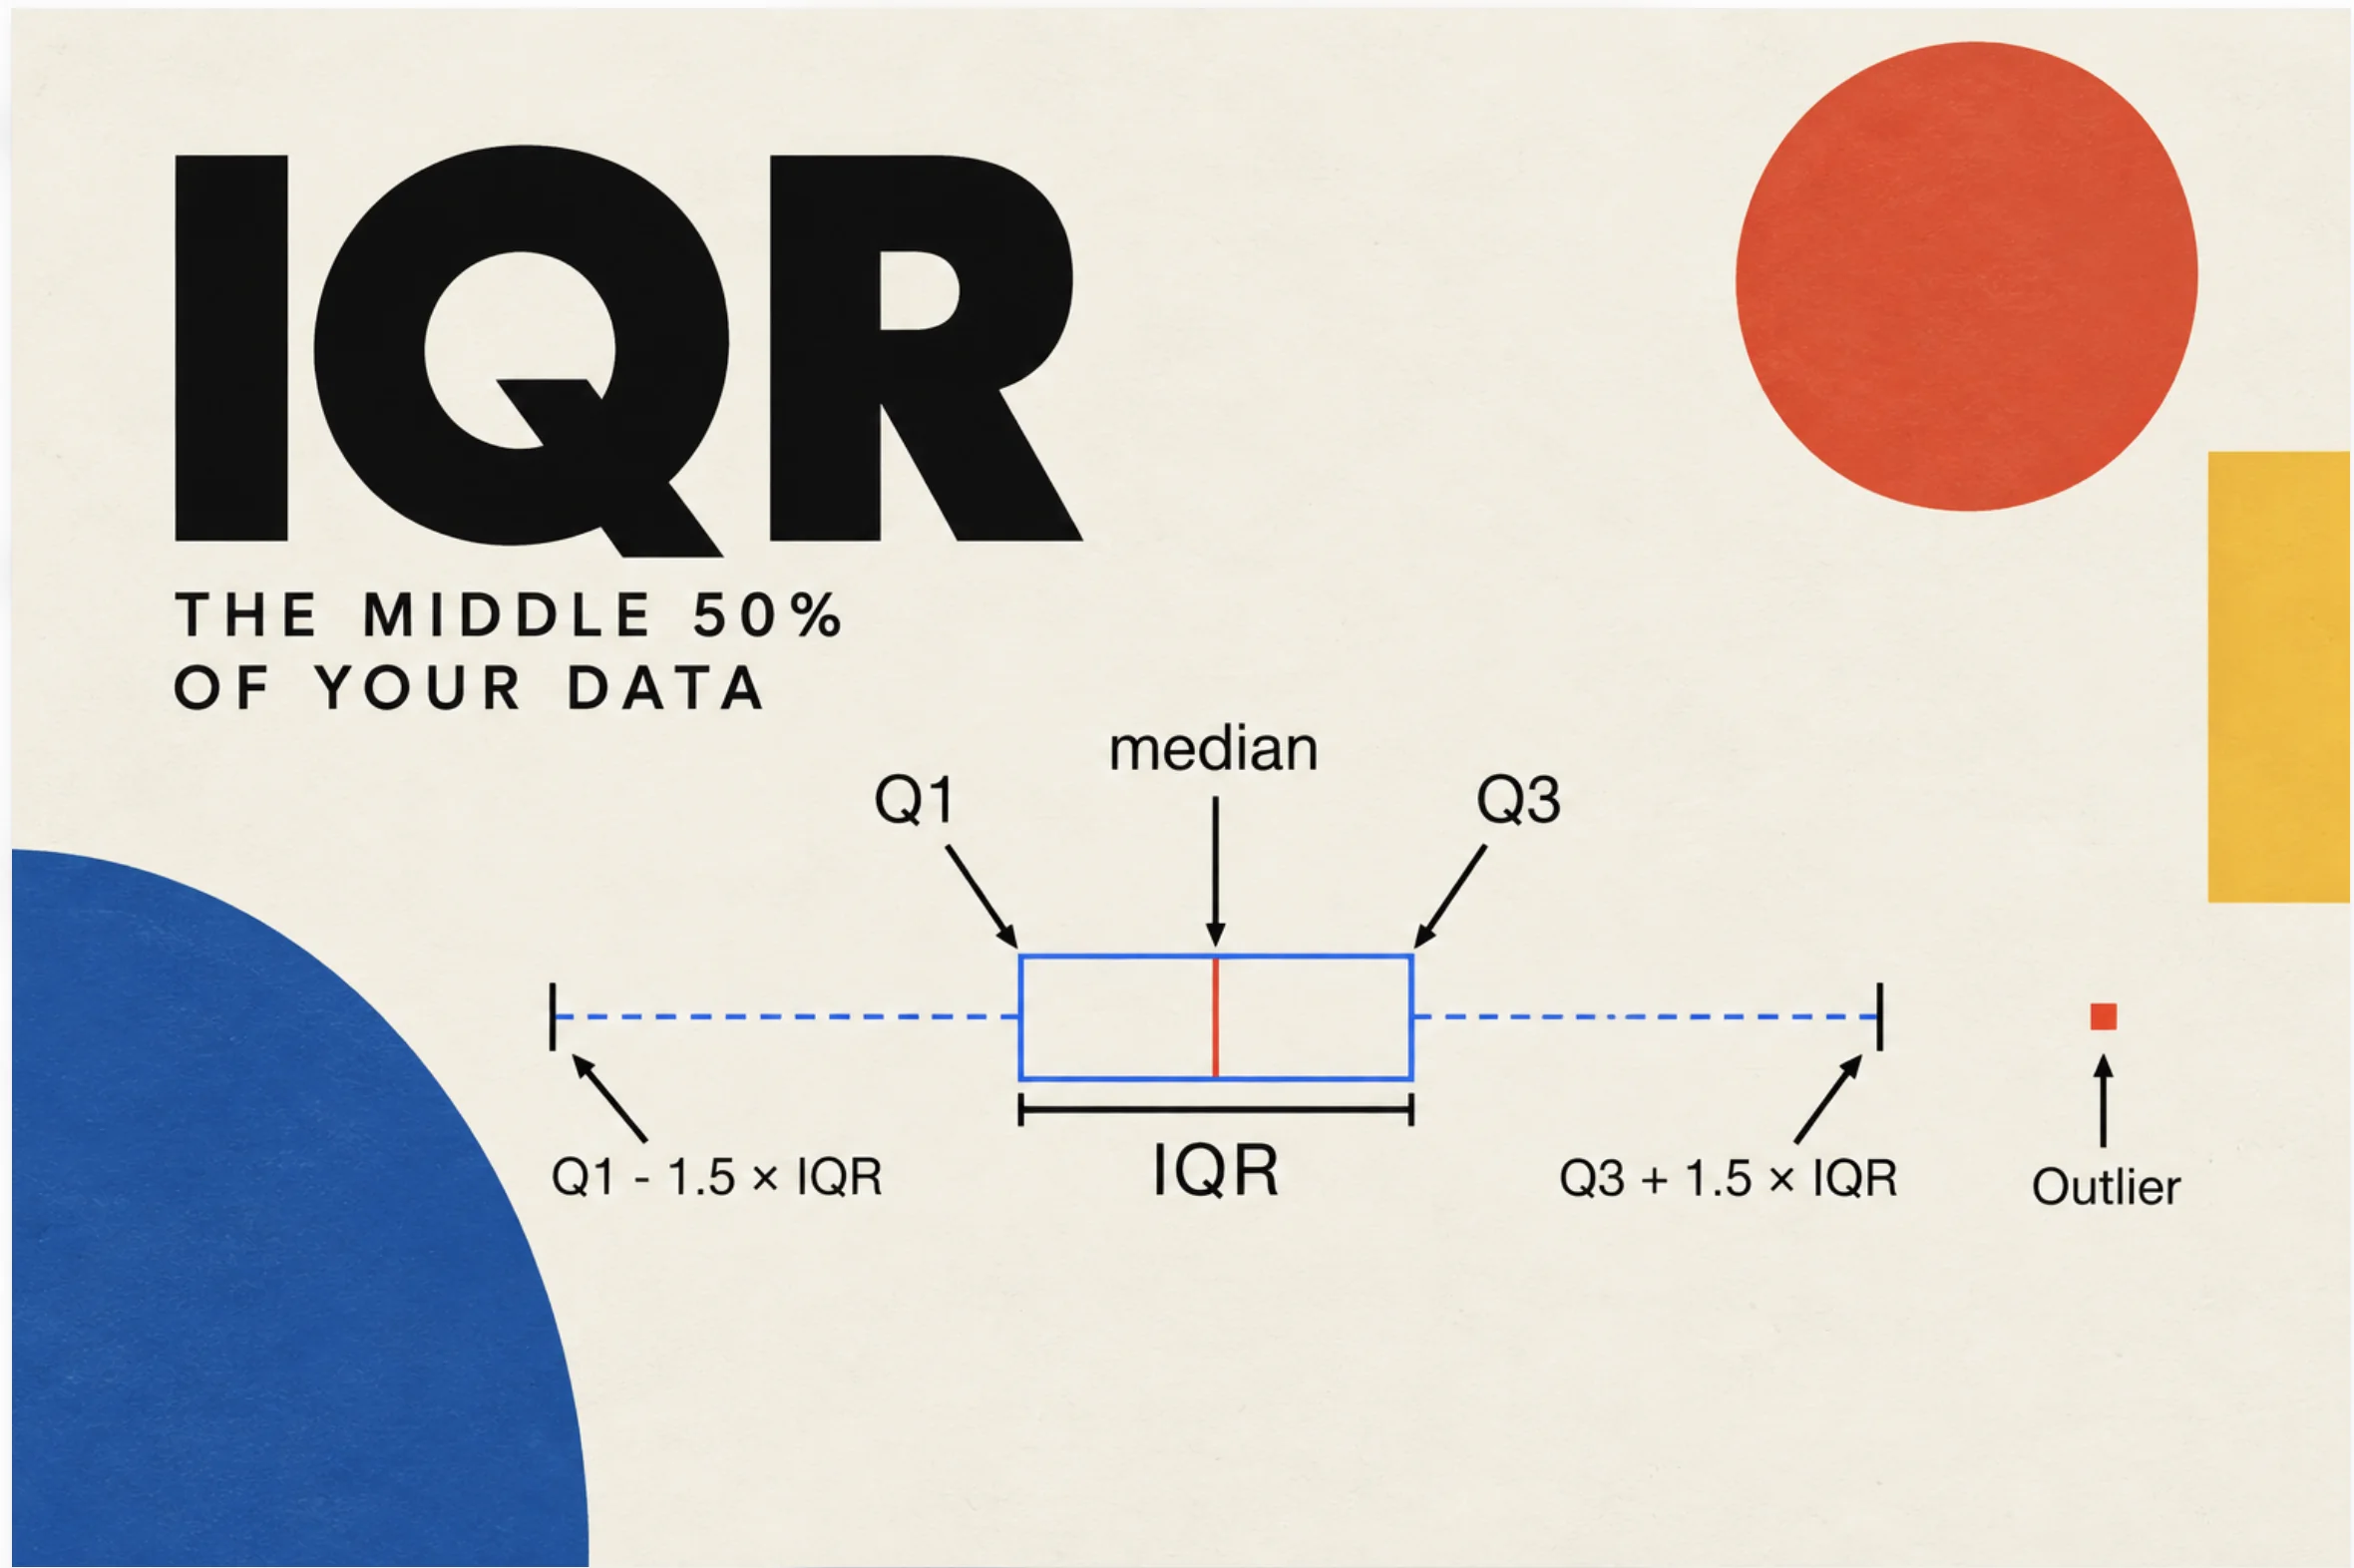
IQR
The middle 50% of your data: spread, outliers and box plots.
 Data fundamentals
From Question to Decision: the PACE Framework
How Plan, Analyze, Construct and Execute structure a data project, up to the executive summary.
 Exploratory analysis · Retail
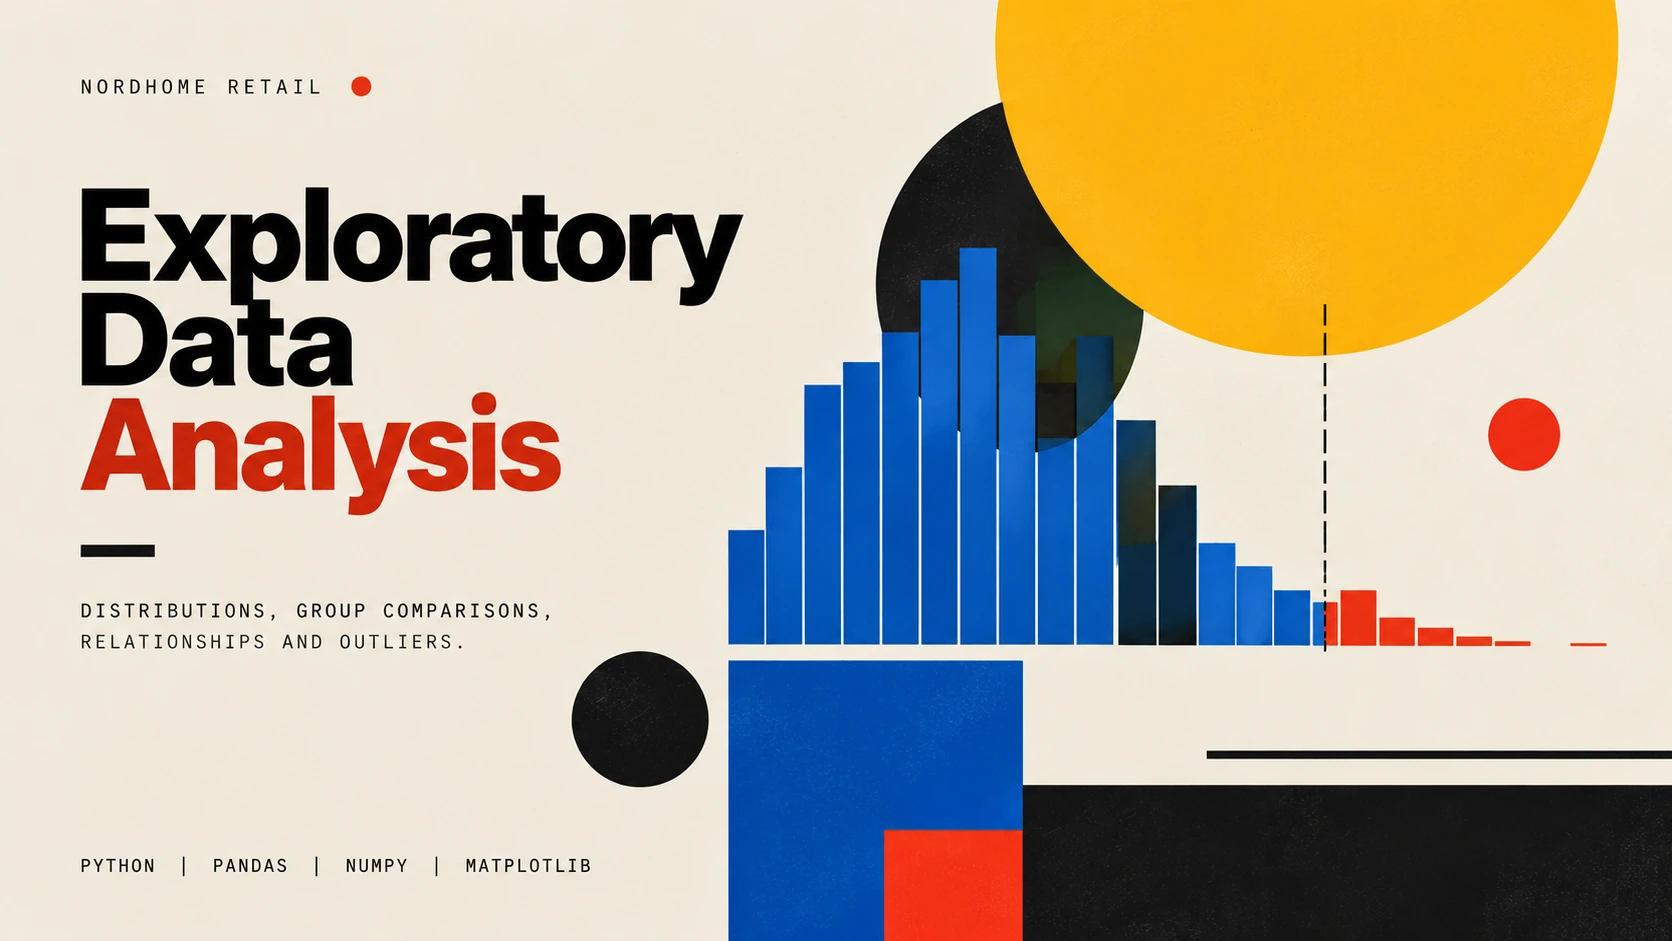
Exploratory Data Analysis
Systematic exploration of NordHome's retail data — distributions, group comparisons, relationships and outliers.
 Data fundamentals
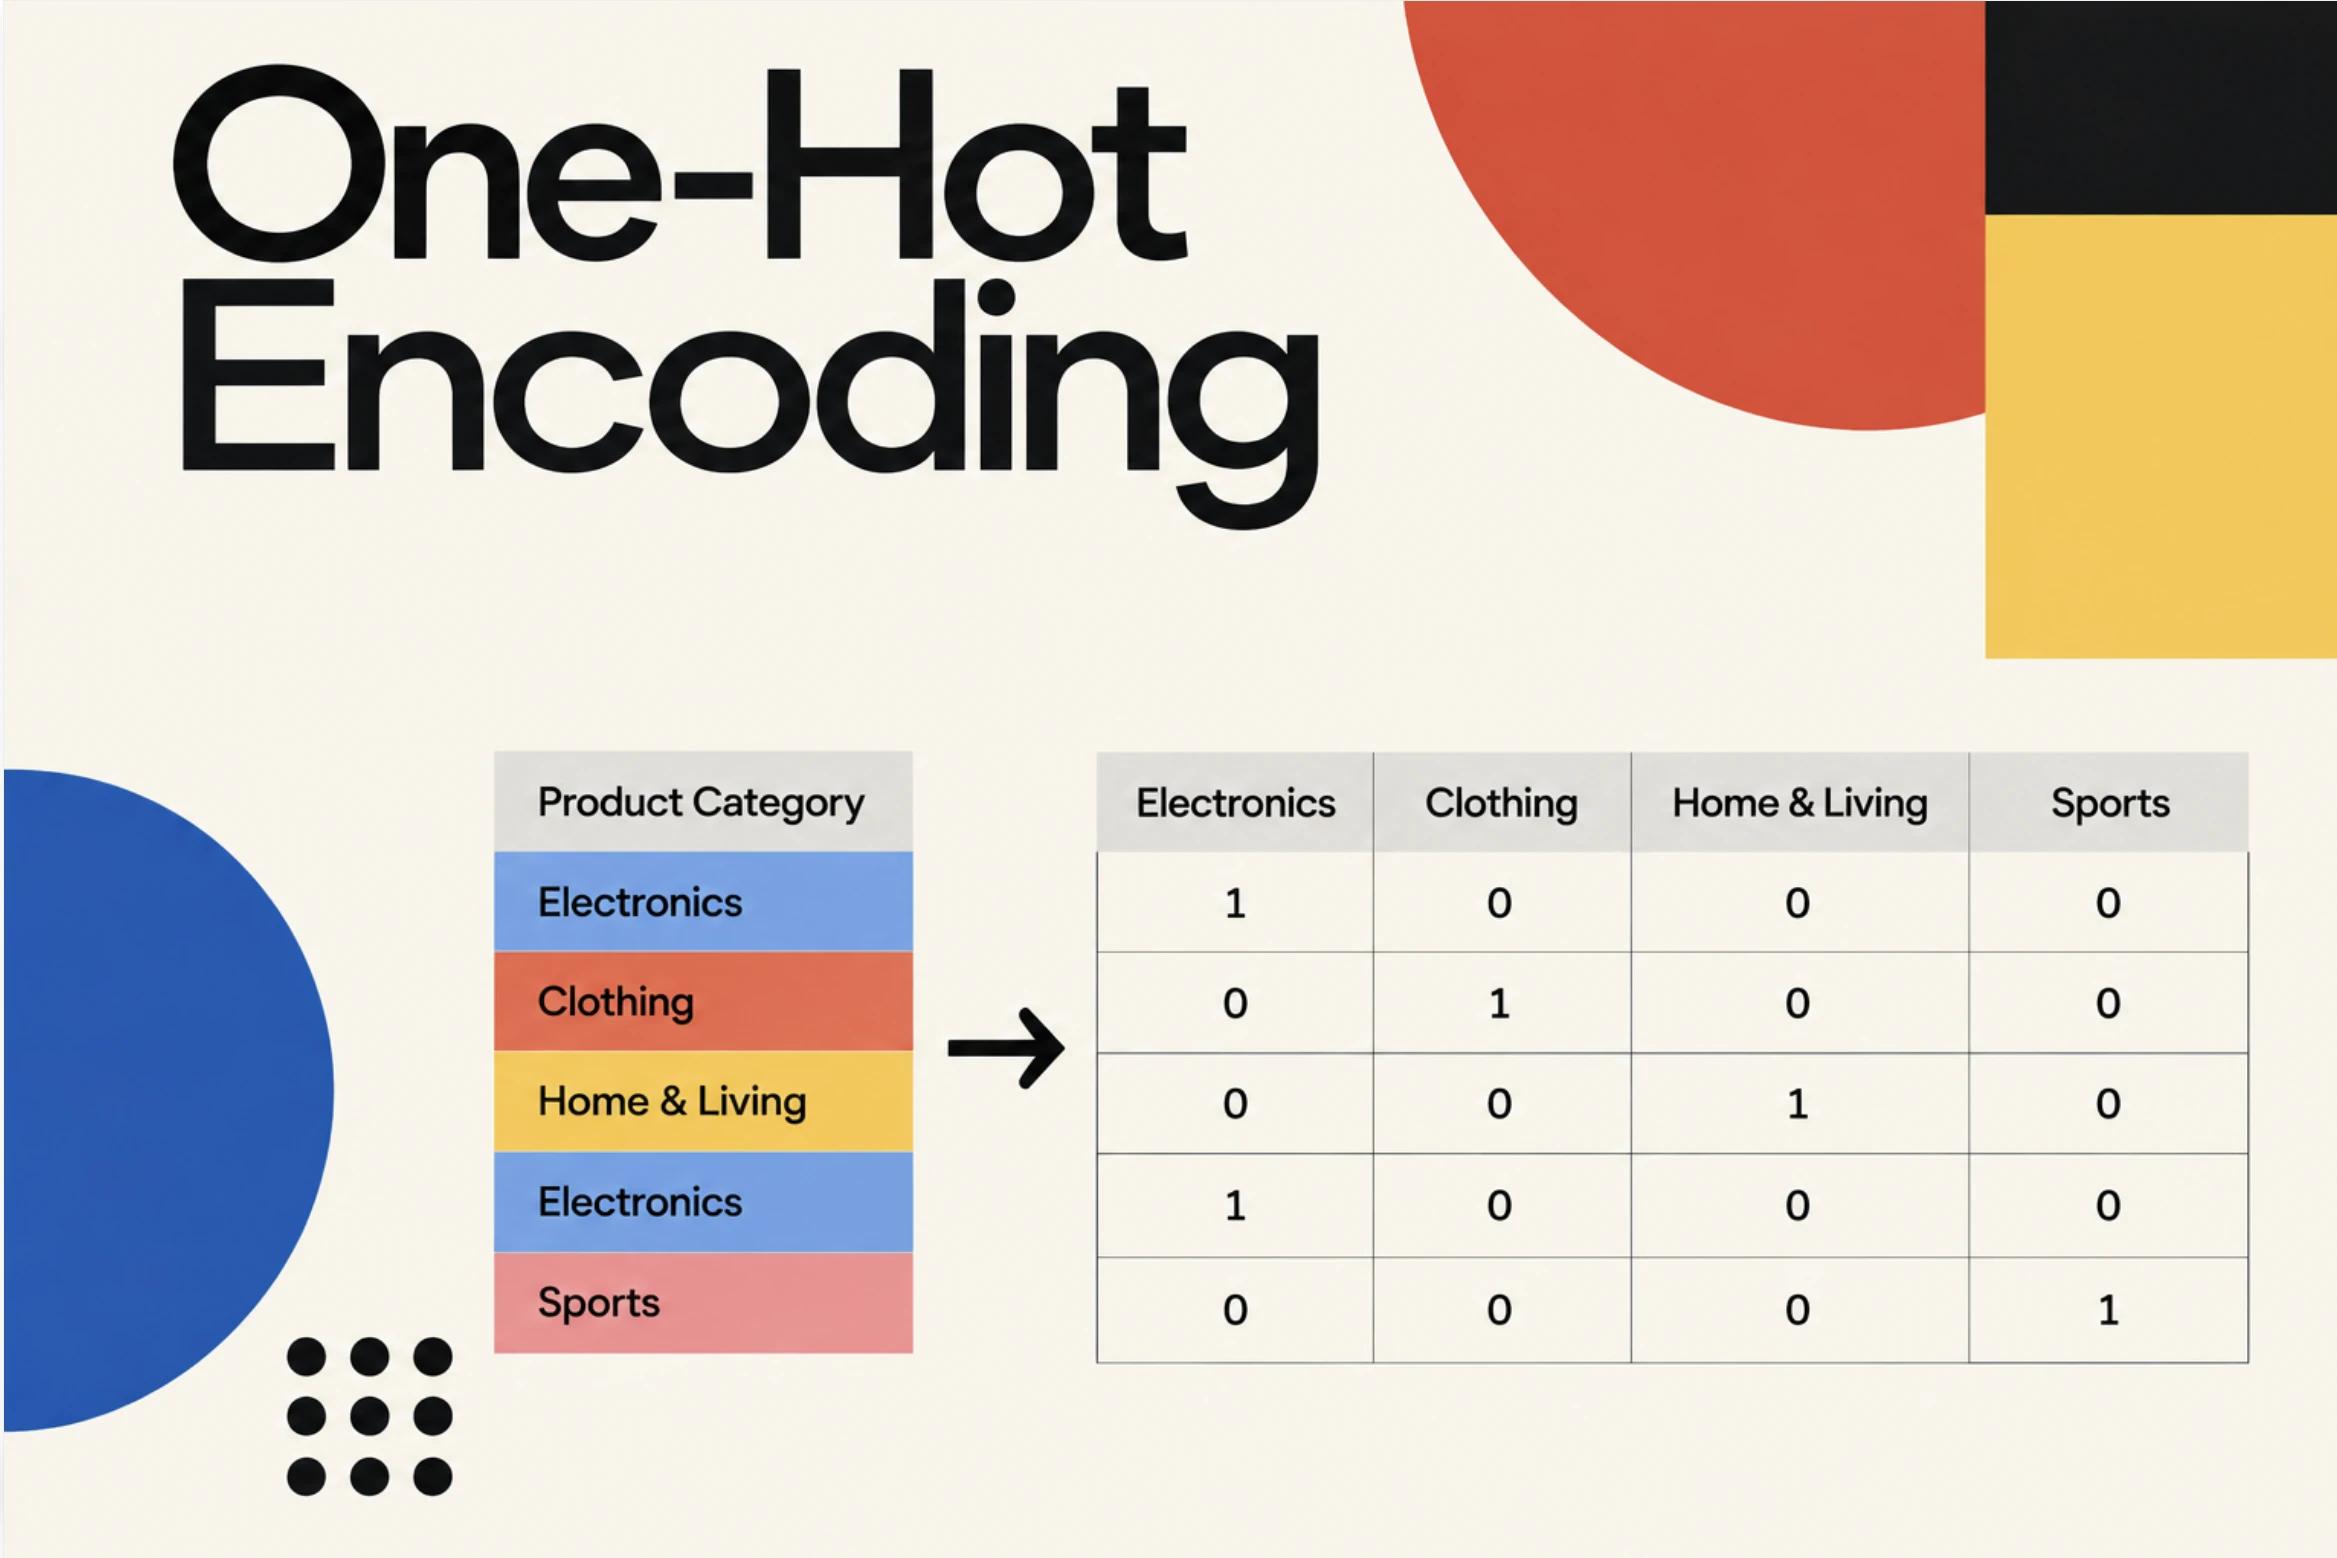
One-Hot Encoding
How to turn categories into numbers a model can use, without inventing an order that isn't there.
Probability
From single events to distributions: the language of uncertainty.
 Probability
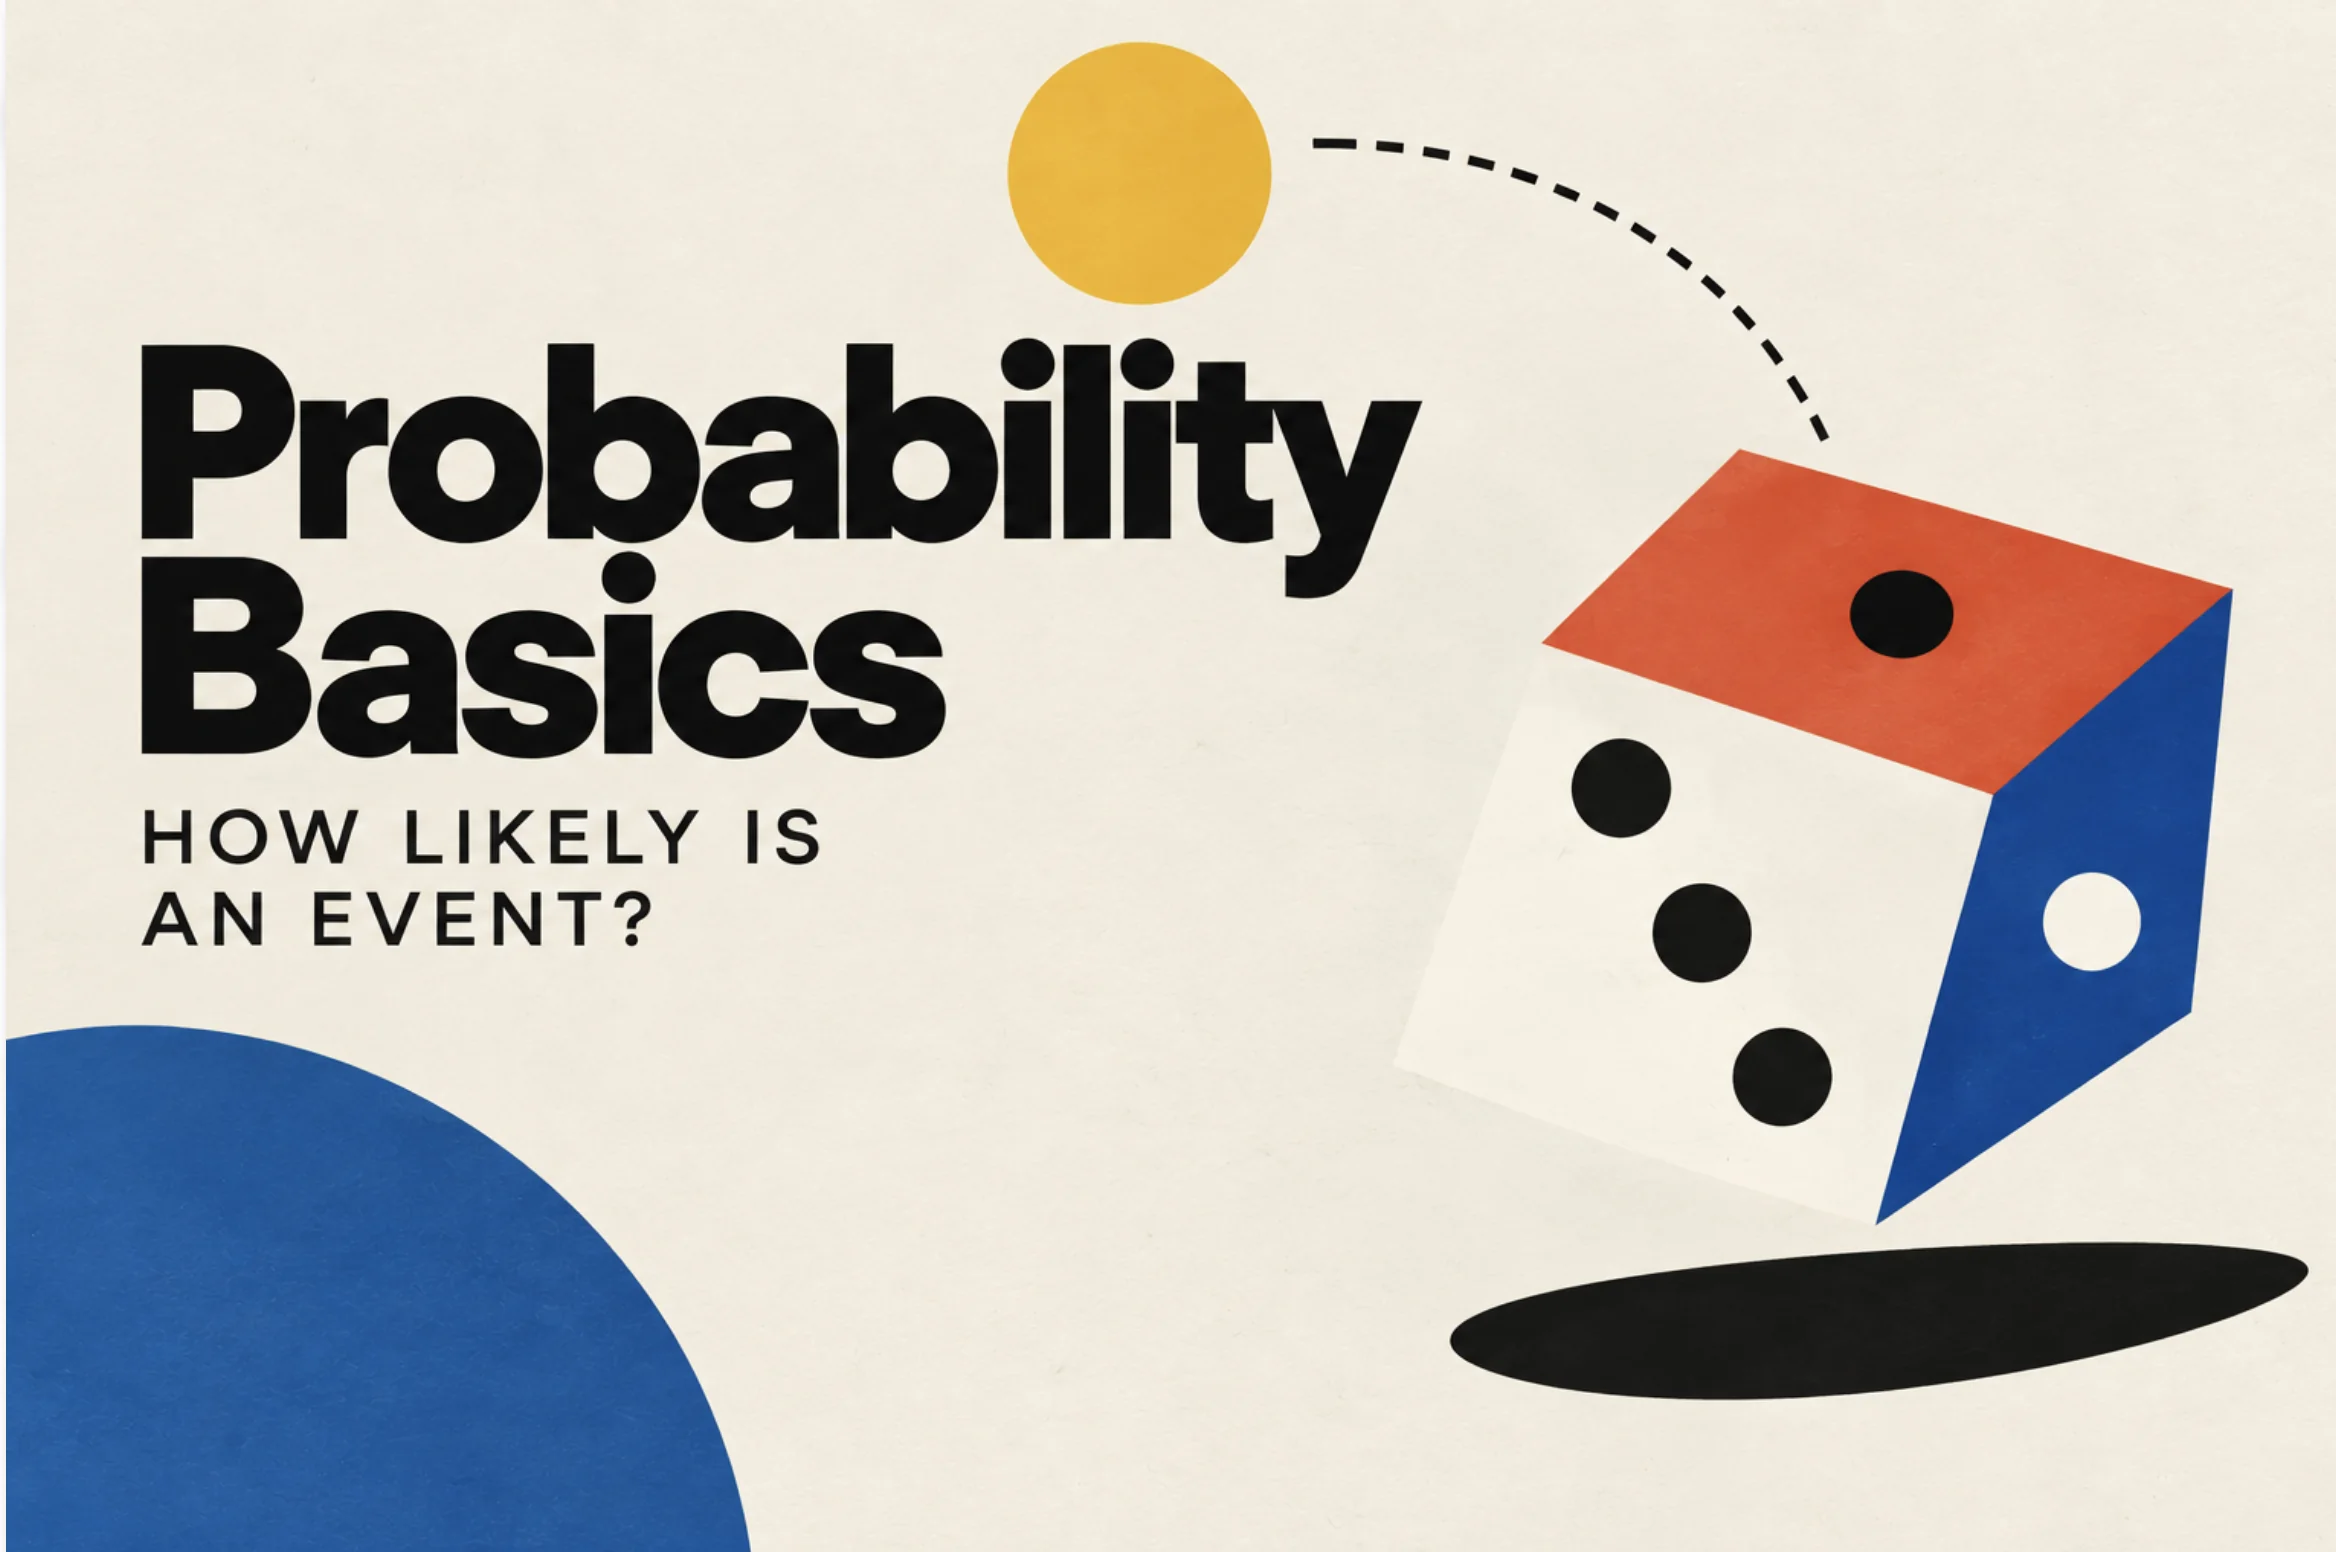
 Basics
How likely is an event? Outcomes, events, and the complement, addition and multiplication rules.
 Probability
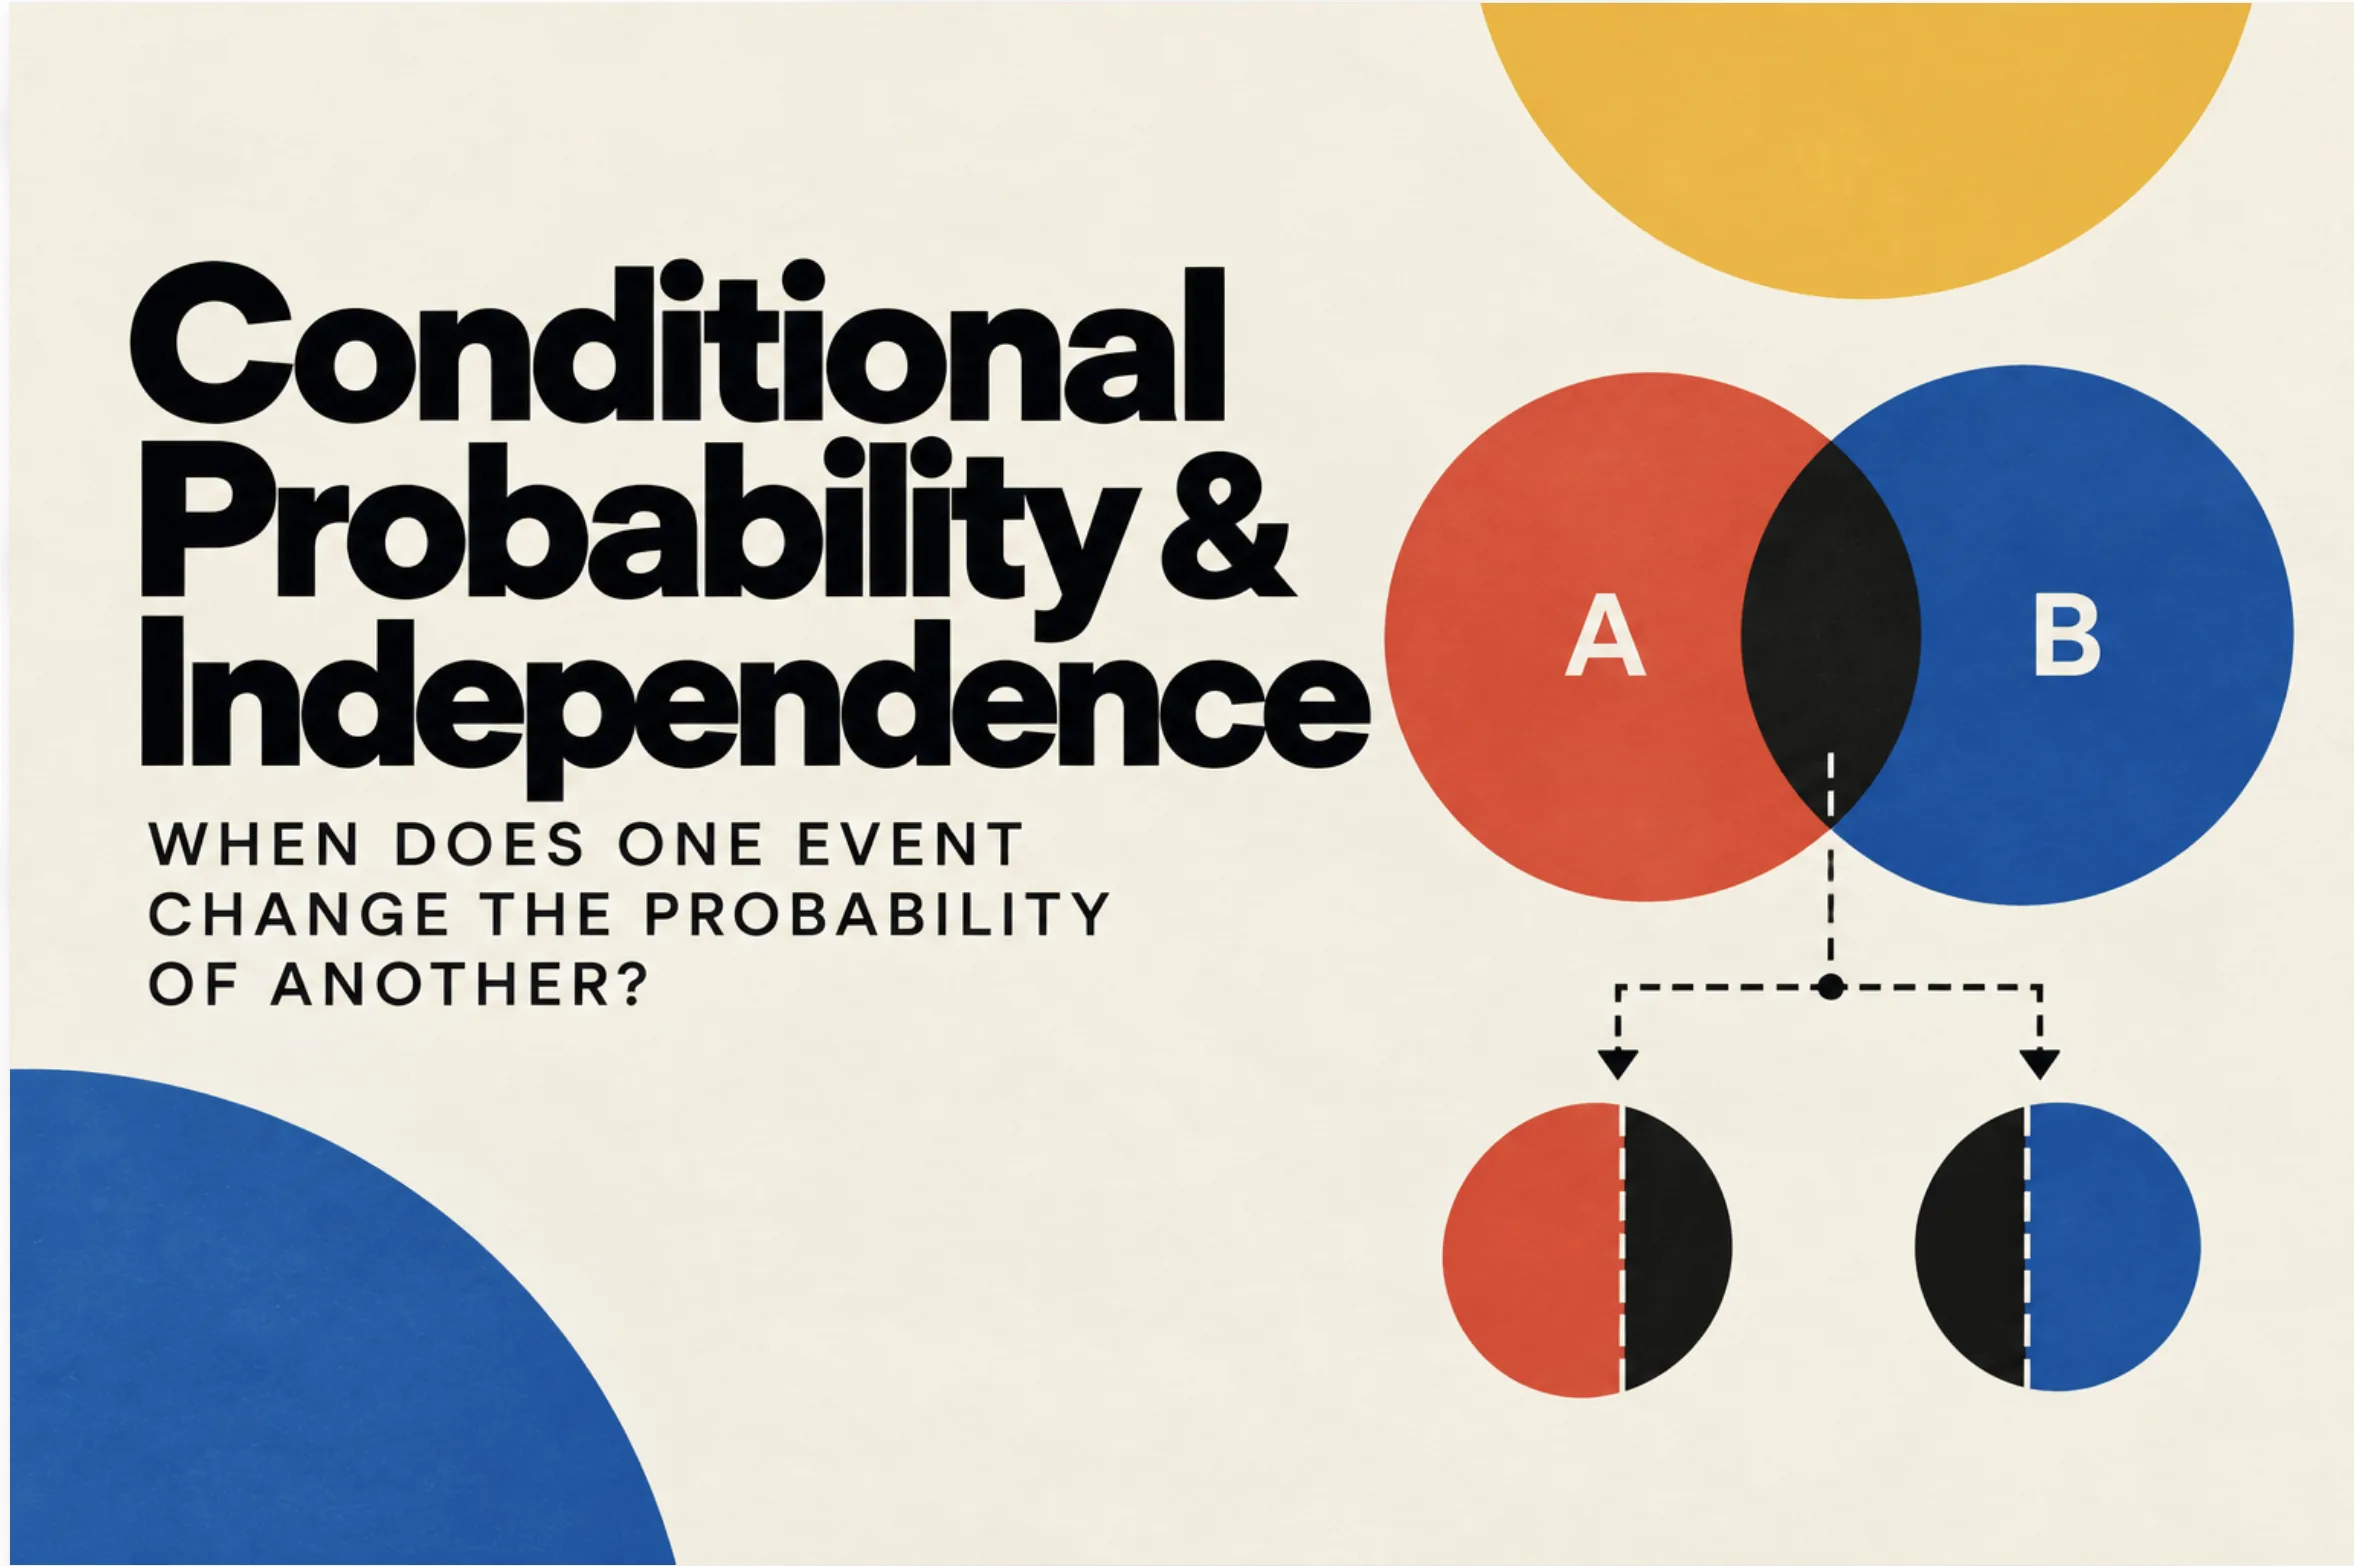
Conditional Probability & Independence
When does one event change the probability of another? Dependent events and P(B | A).
 Probability
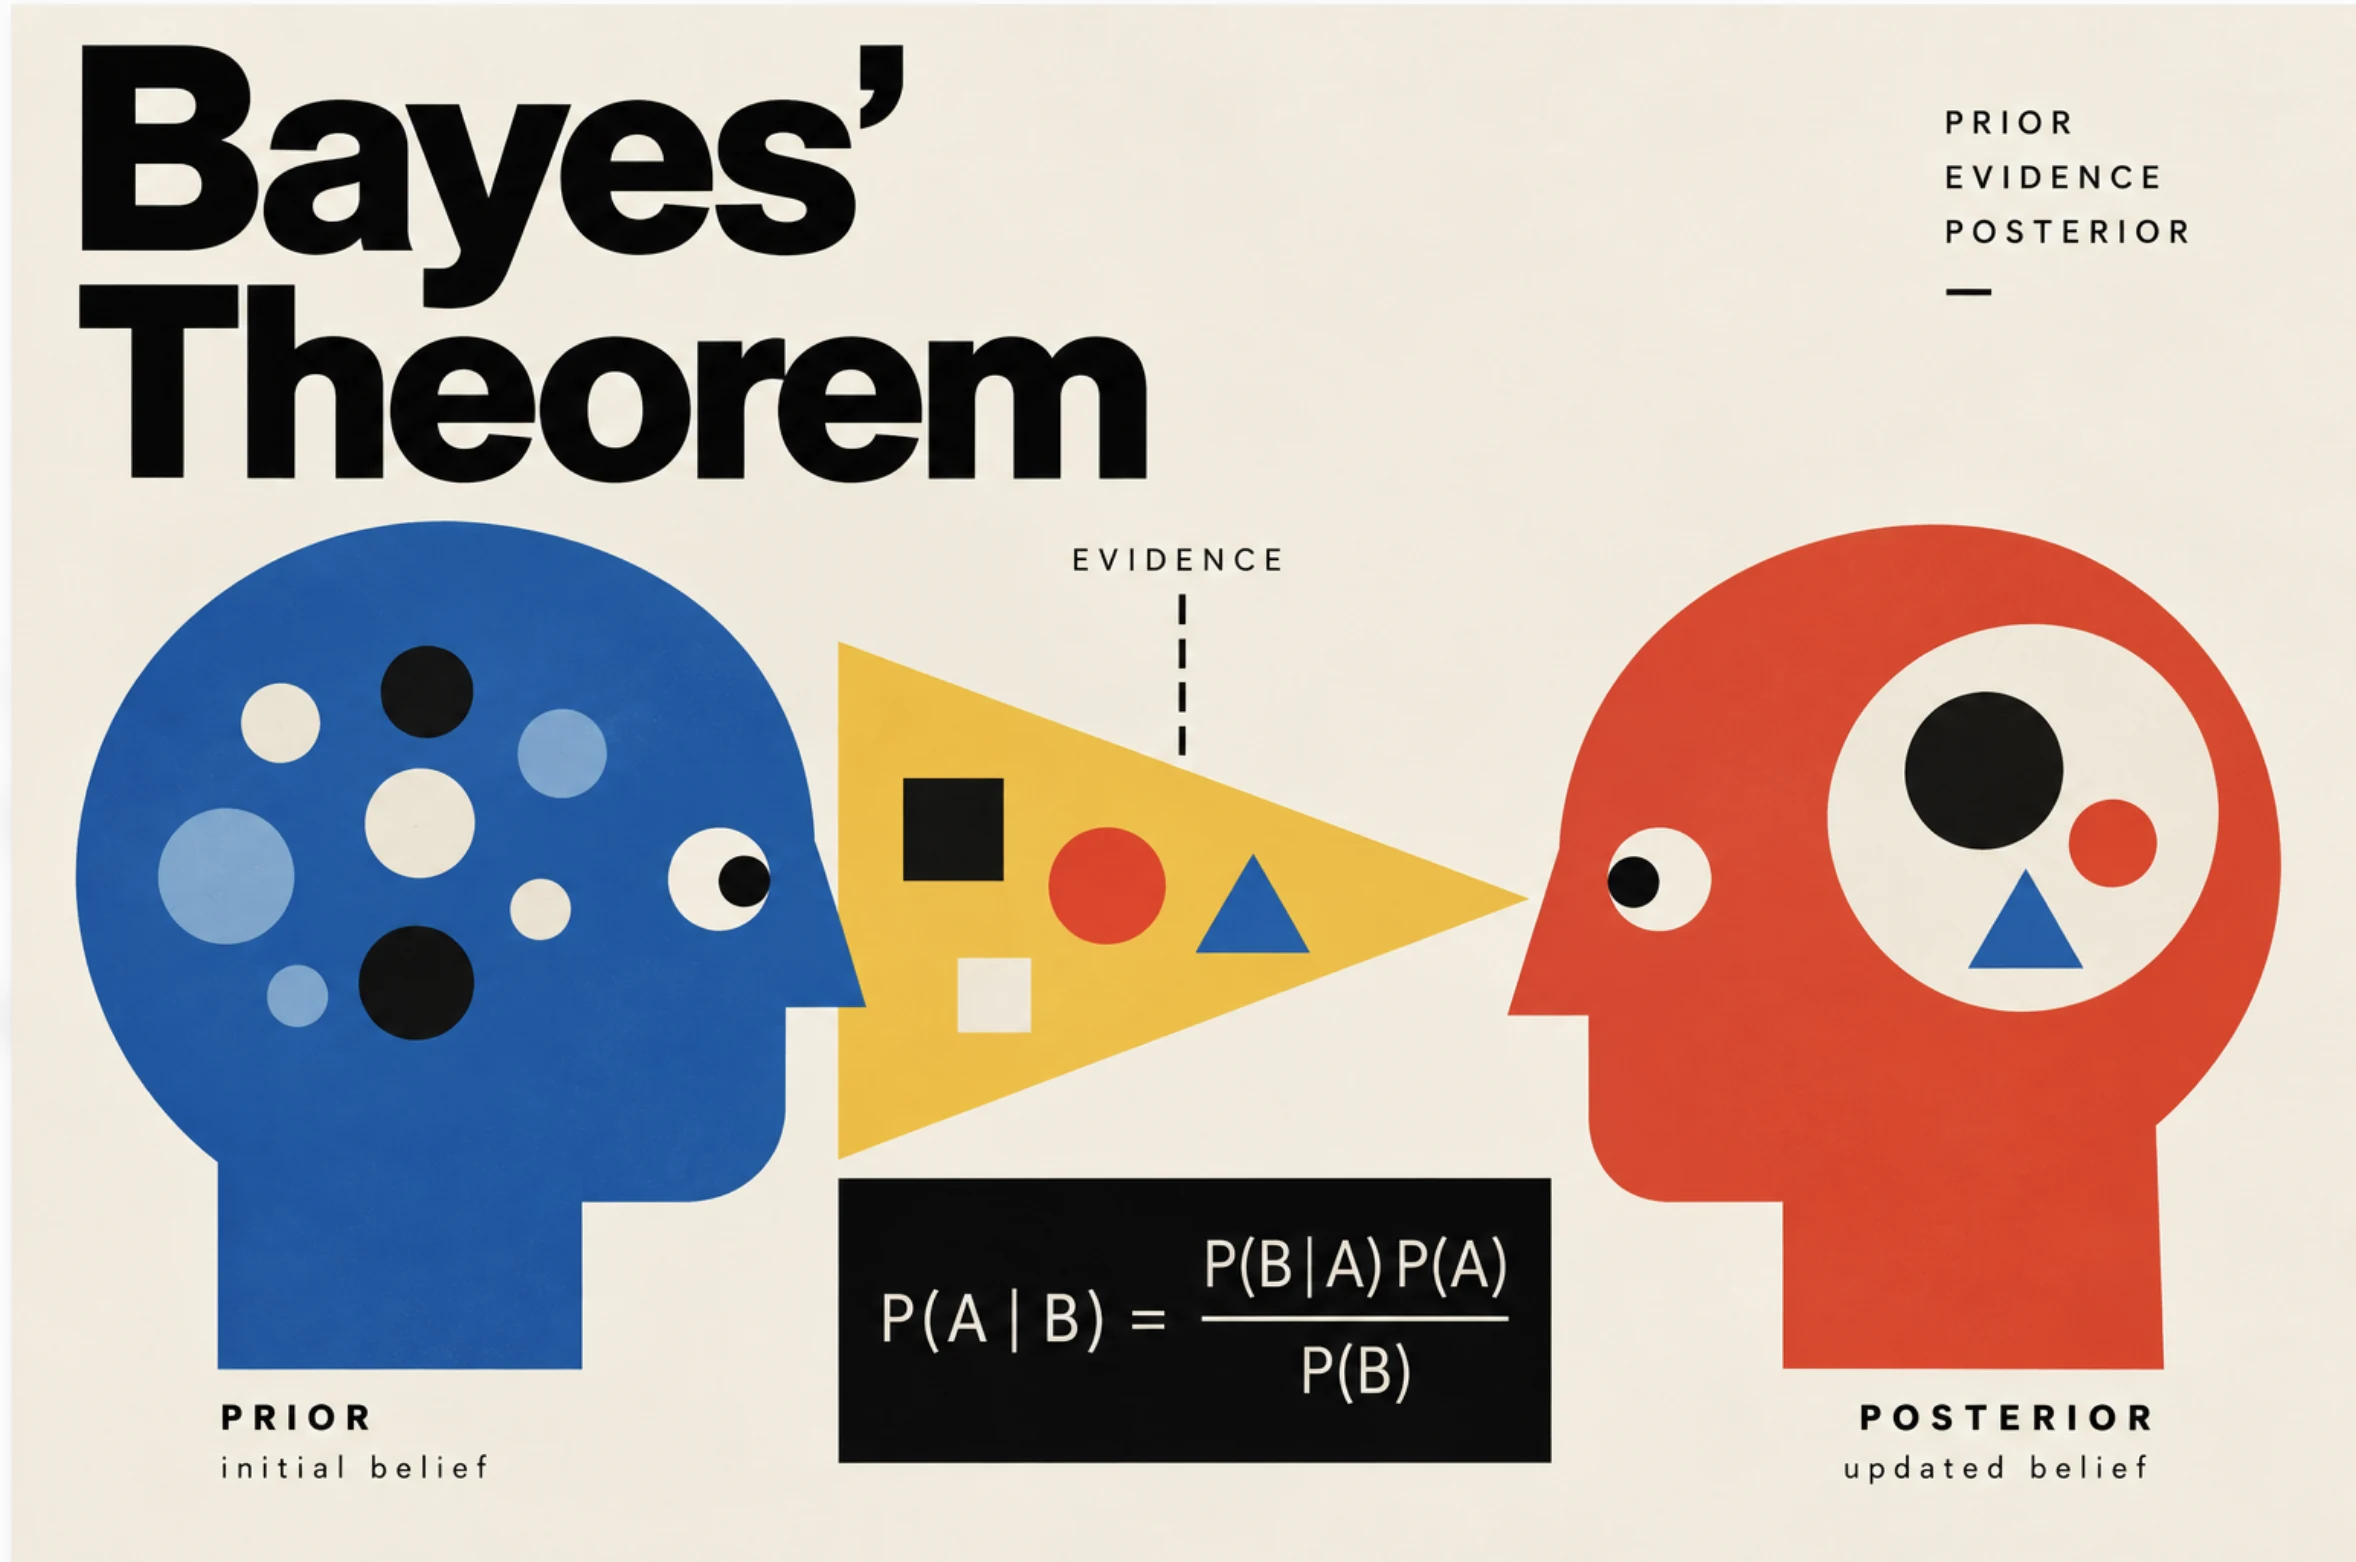
Bayes’ Theorem
How to update a belief with new evidence: prior, likelihood, posterior, and why an alert can still be wrong.
 Probability
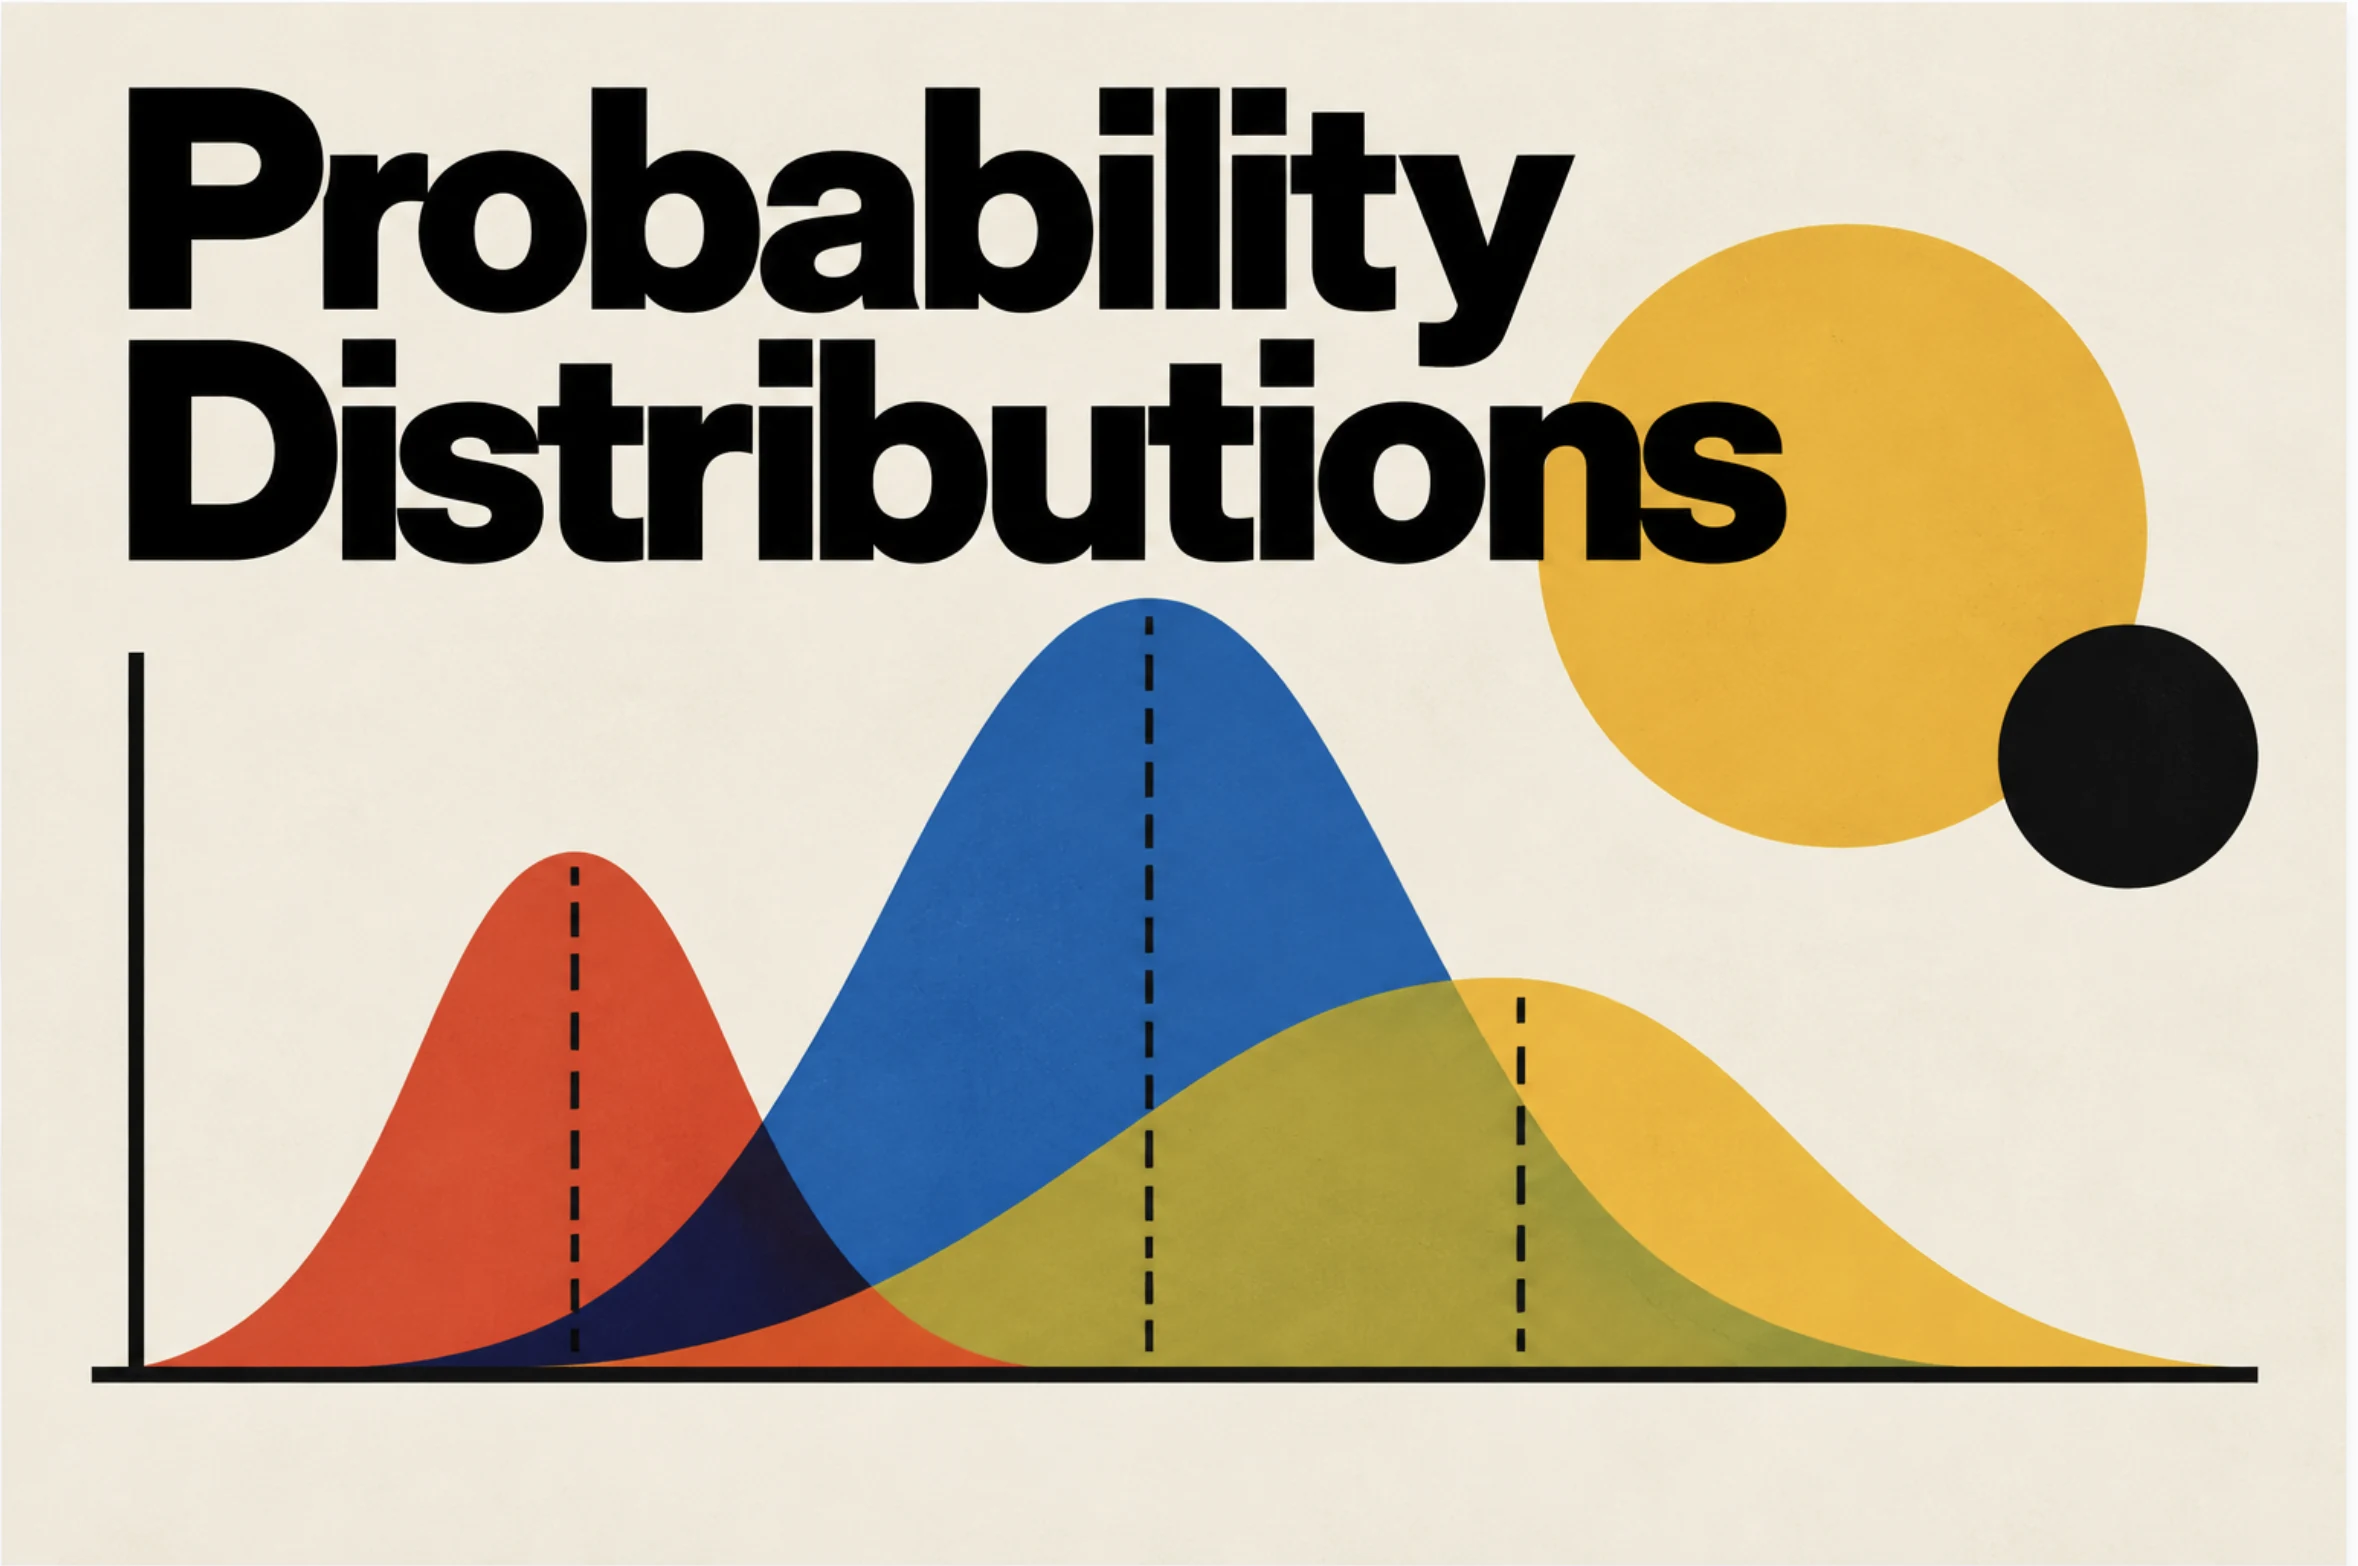
Random Variables & Probability Distributions
From a random variable to PMF, PDF and CDF: how to describe uncertainty in discrete and continuous data.
 Probability
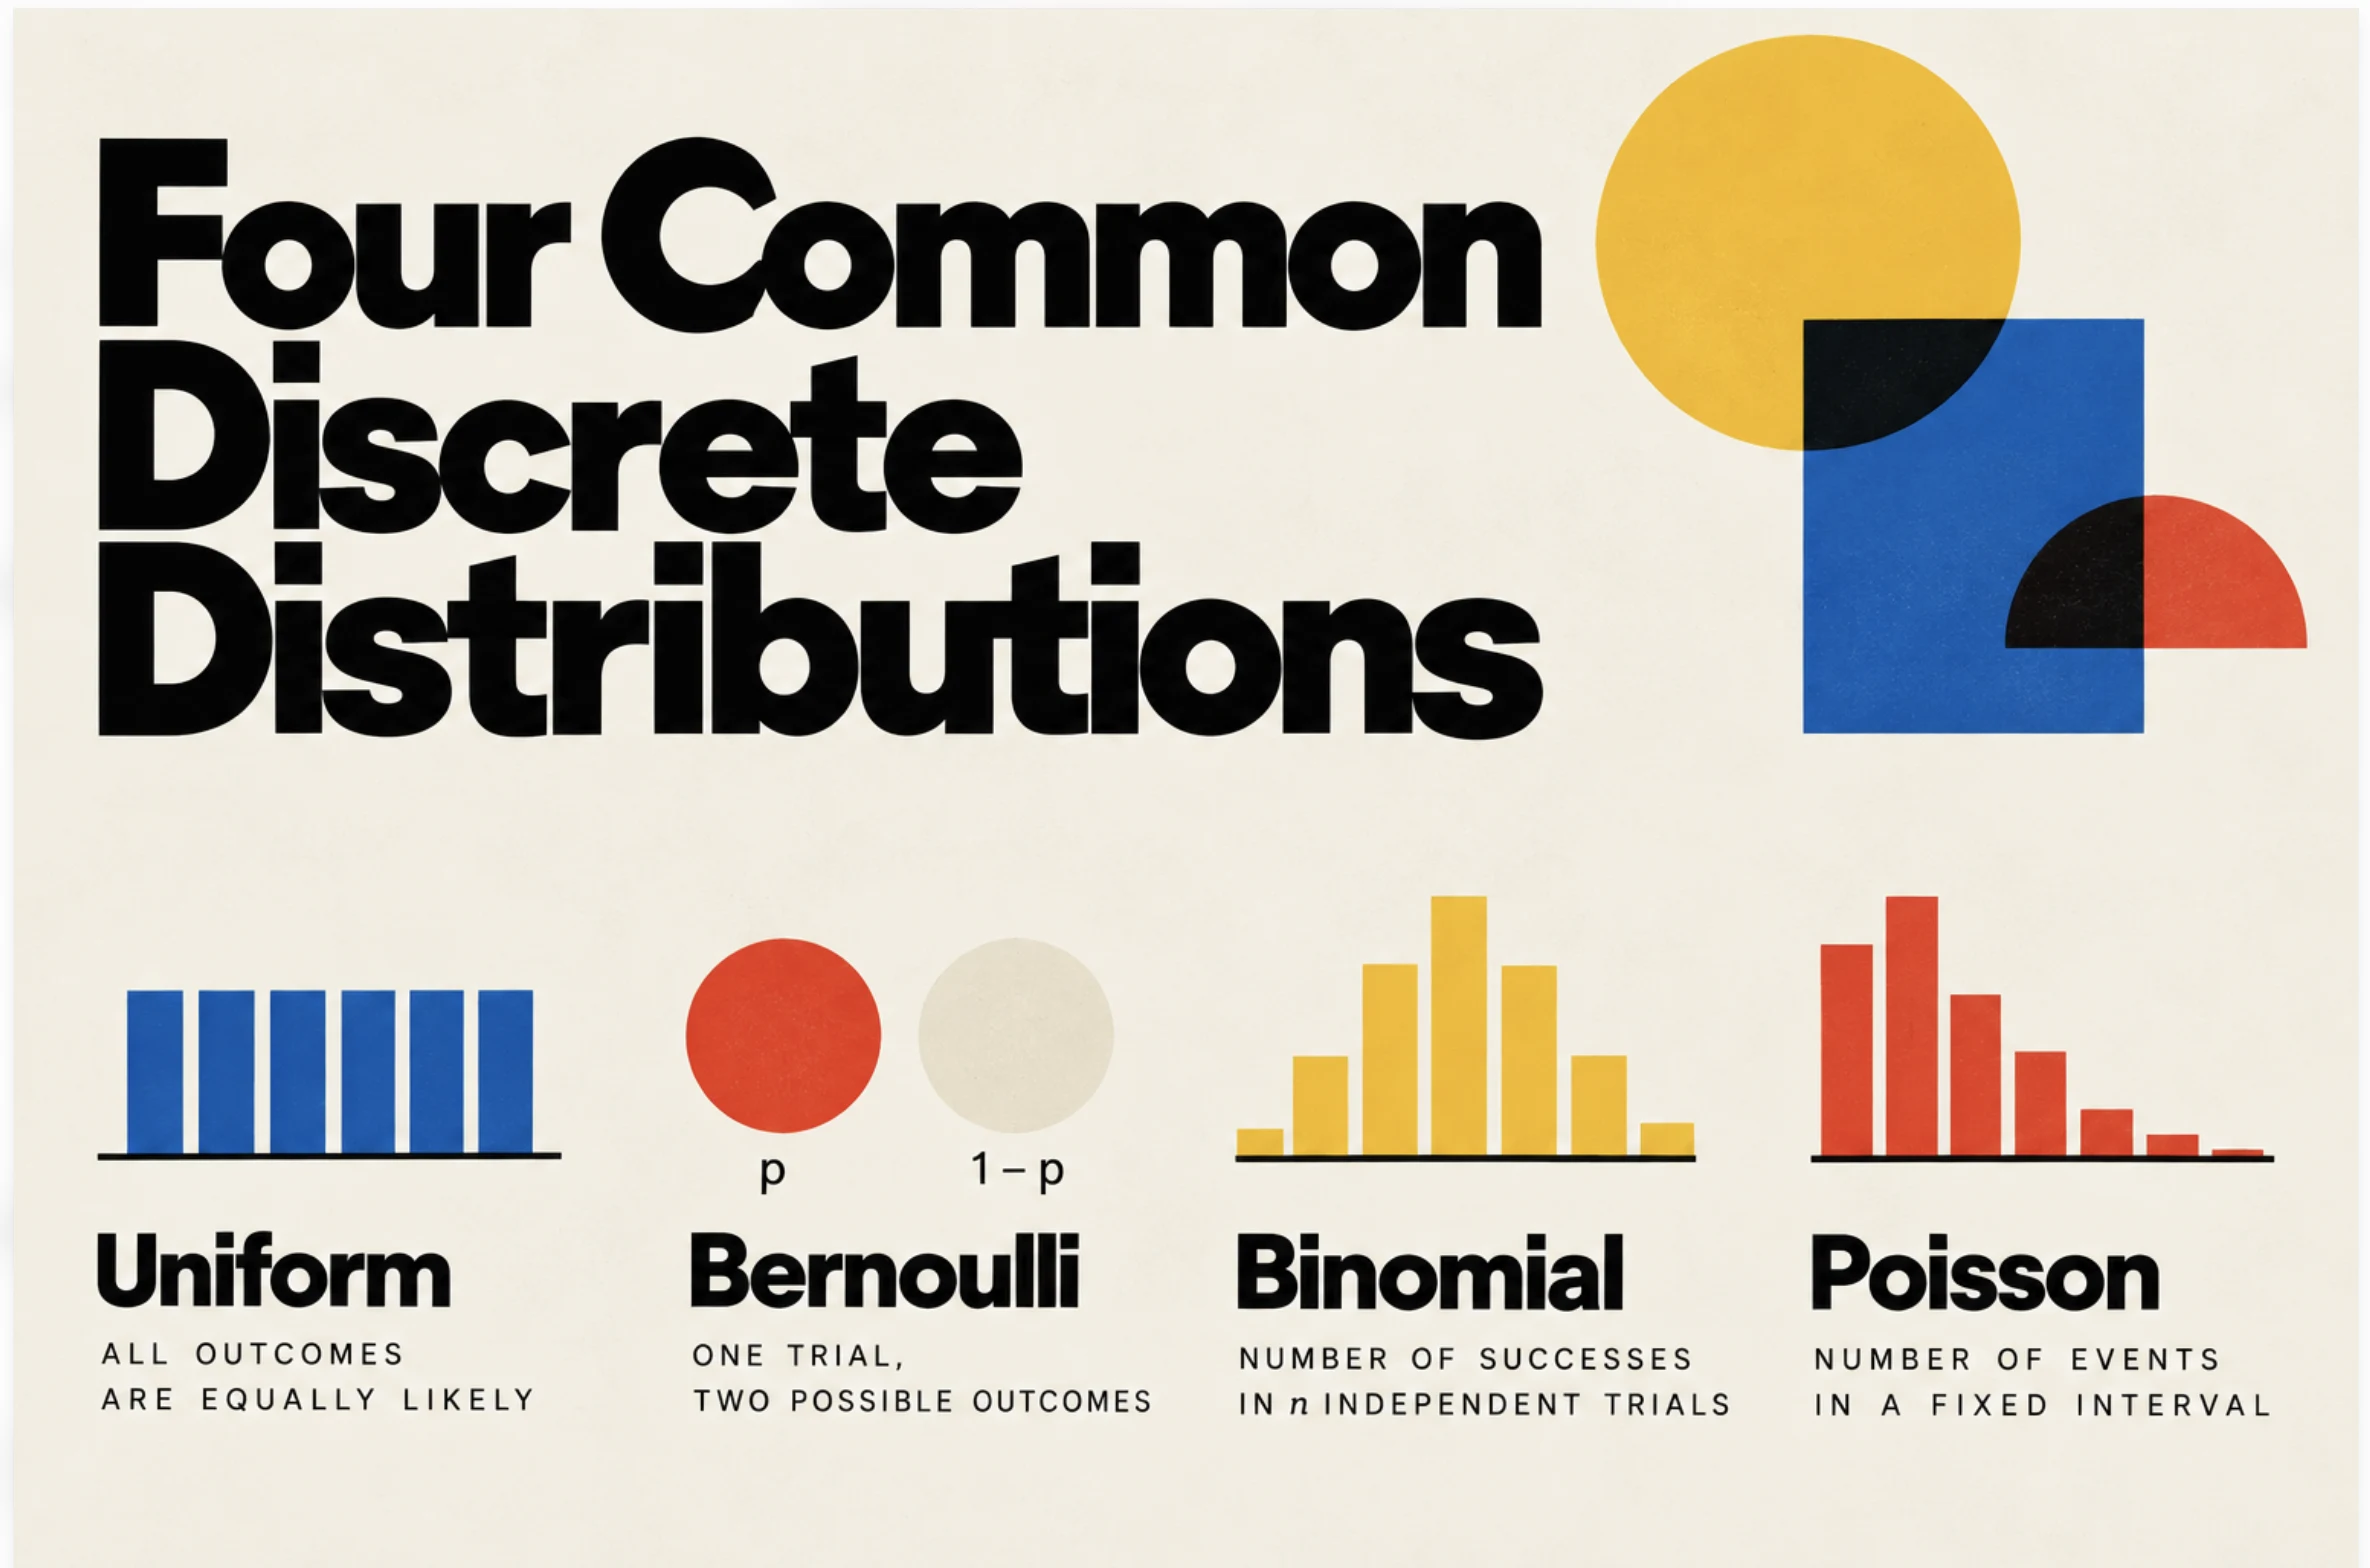
Four Common Discrete Distributions
Uniform, Bernoulli, binomial and Poisson: what each one models and when to use it.
 Probability
Normal Distribution
The bell curve and the 68-95-99.7 rule: what is typical, what is rare, and how to spot outliers.
 Probability
Common Continuous Distributions
Uniform, normal, exponential and log-normal: what each one models and when to use it.
Sampling
How to choose the data you analyze, and how to avoid bias.
 Sampling
 Methods
Probability and non-probability sampling: how each method works and how it can bias your data.
 Sampling
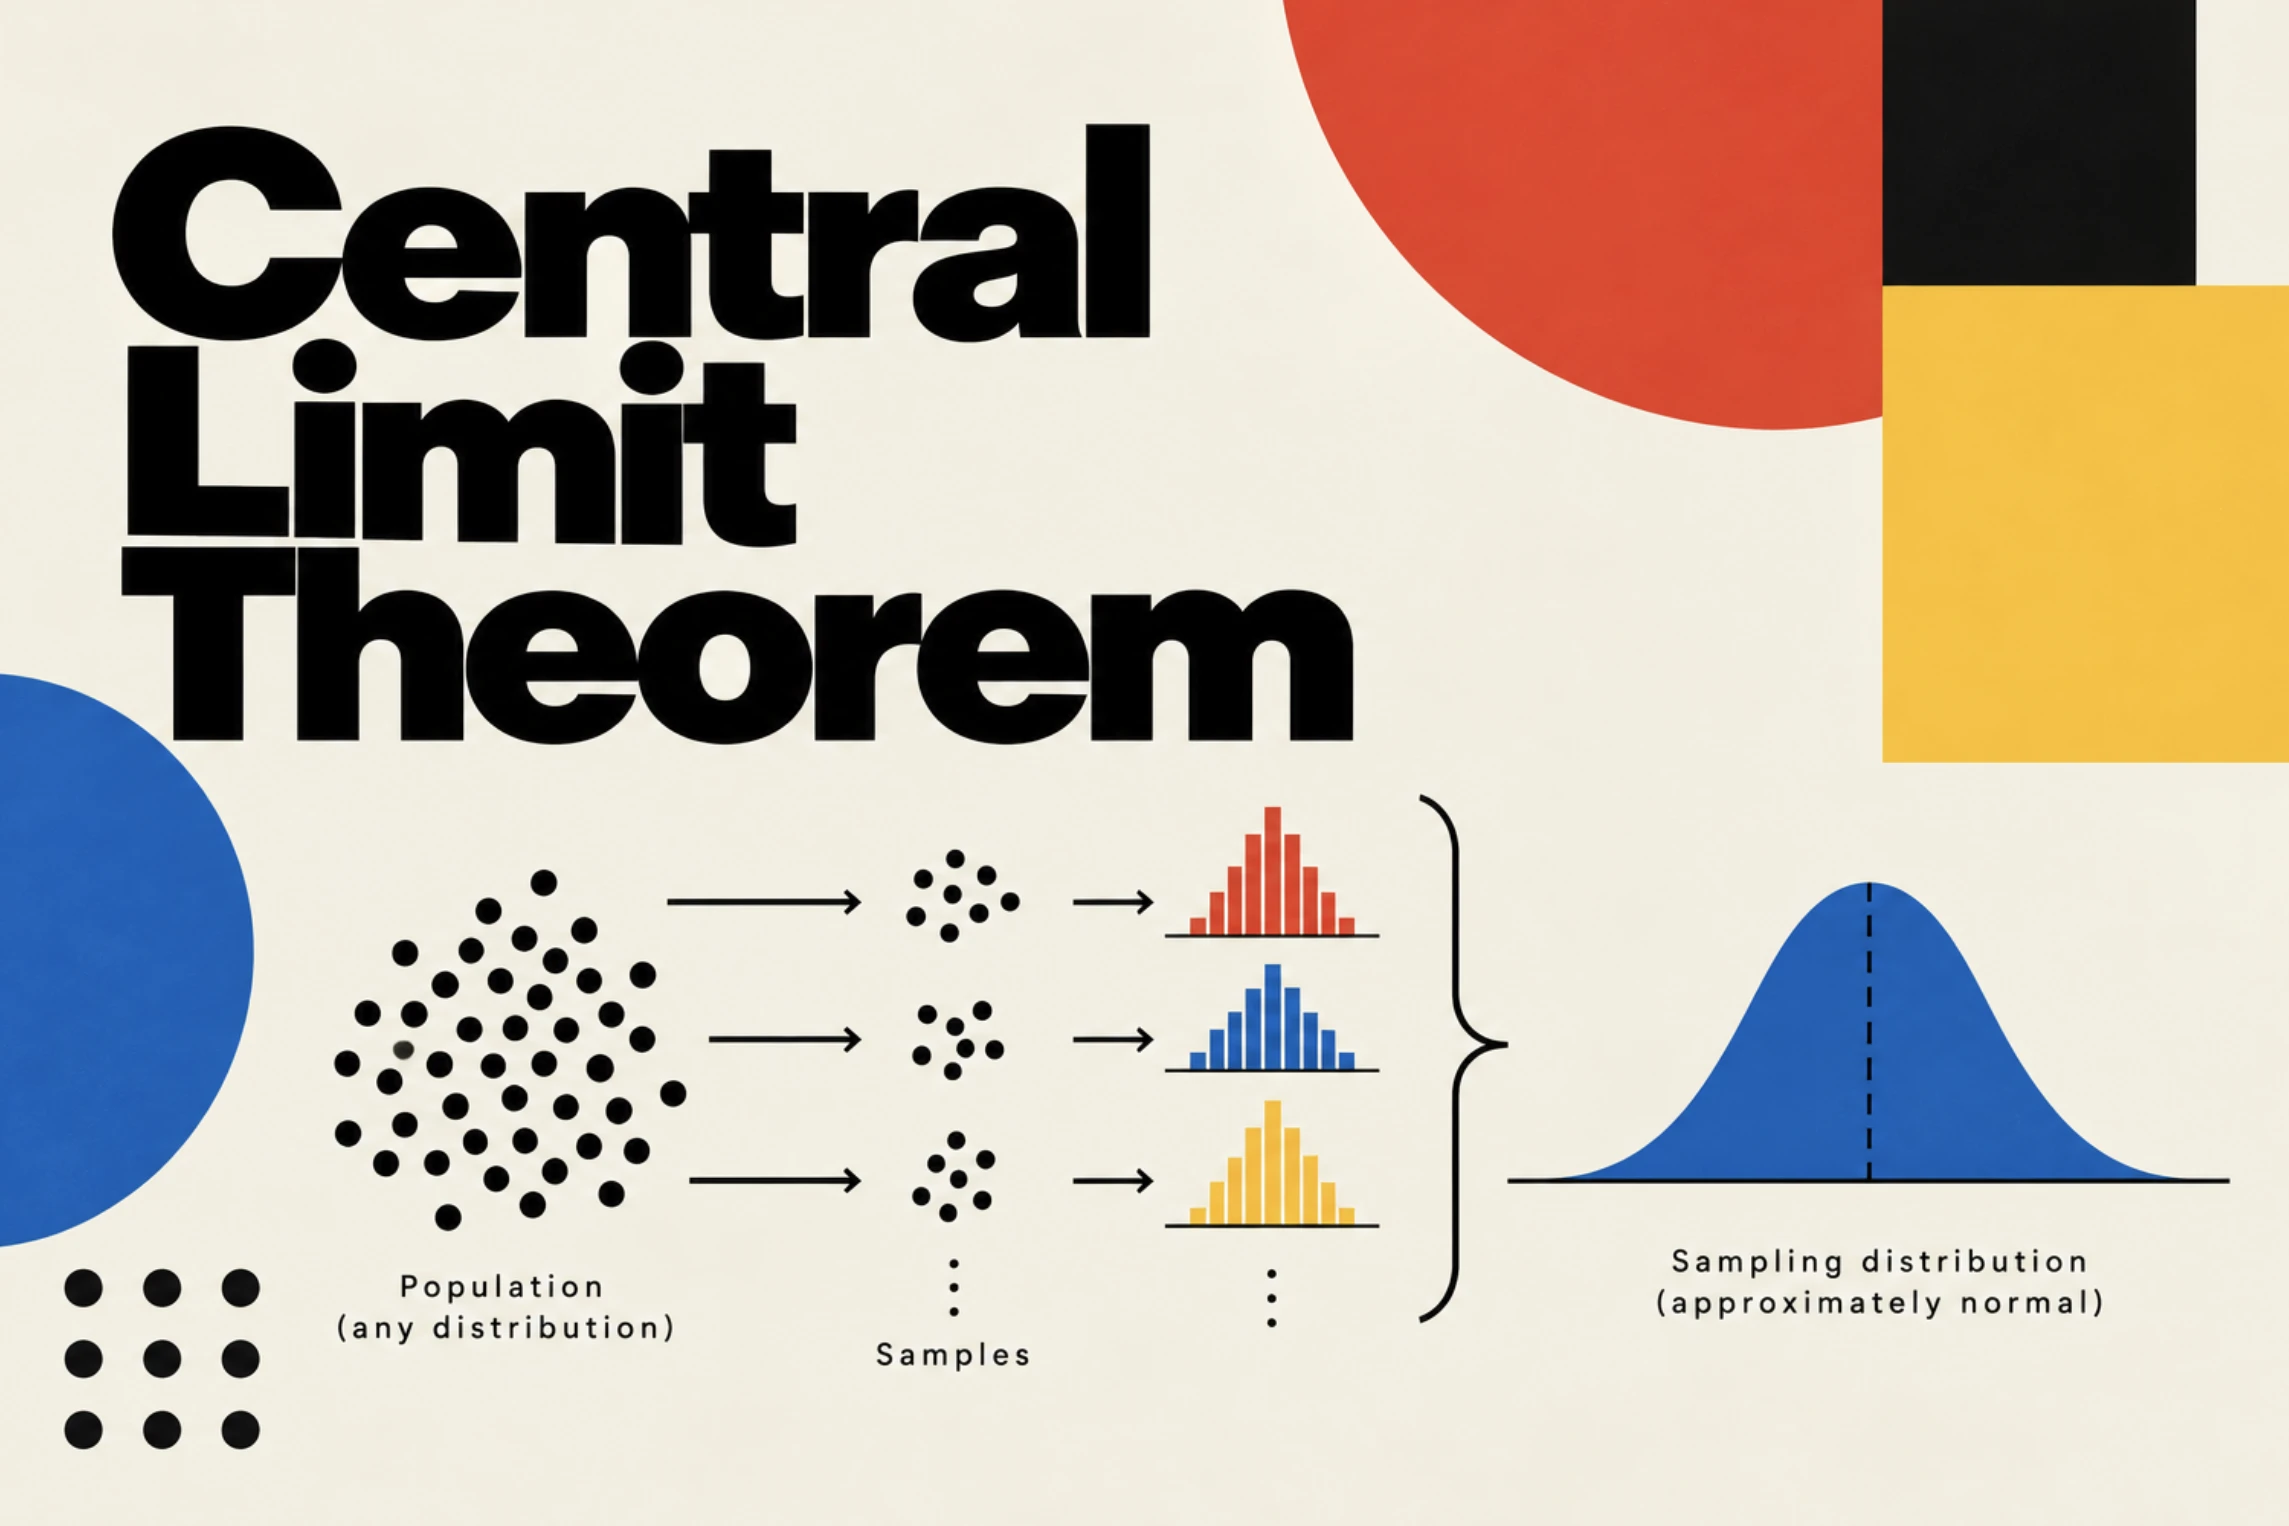
Central Limit Theorem
Sampling distributions, standard error, and why the means of repeated samples form a bell curve.
Inference & experiments
Test whether a change really made a difference.
 Inference
Confidence Intervals
Why a range beats a single estimate, how to read a 95% interval, and what it does not mean.
 Inference
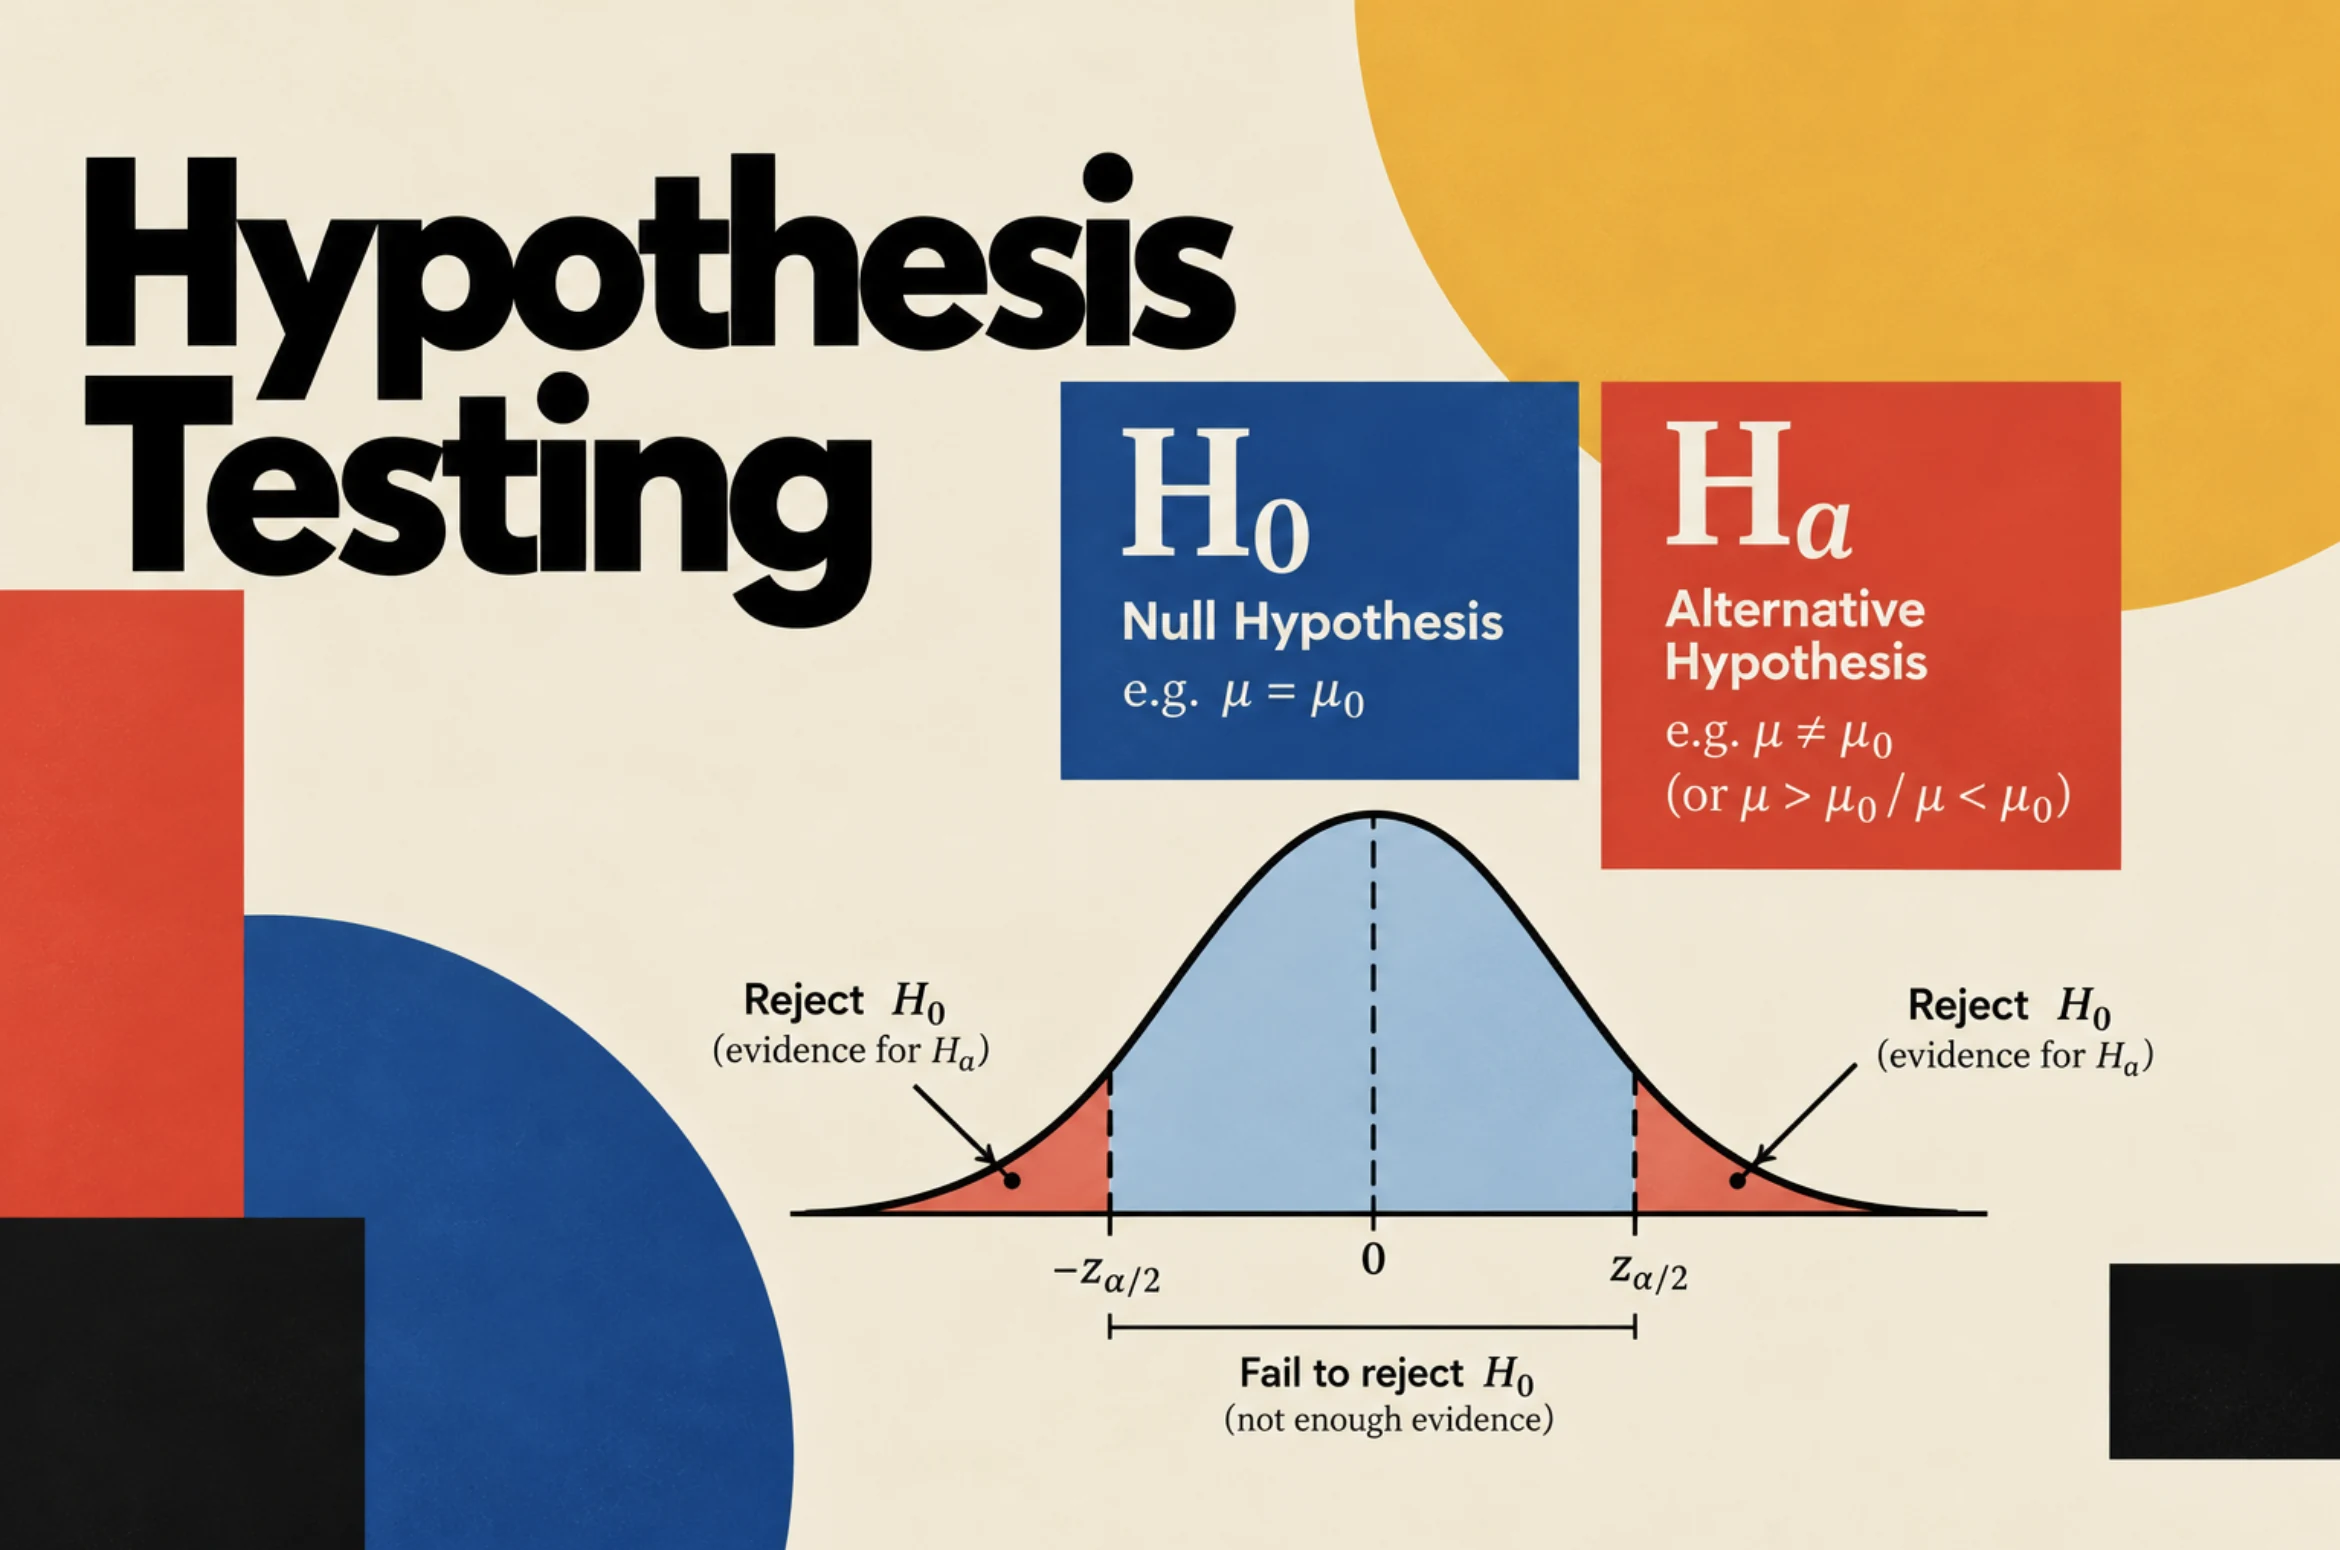
Hypothesis Testing
Is a difference real or just luck? Significance level, p-value, t-test and power, shown on a checkout redesign example.
 Experimentation
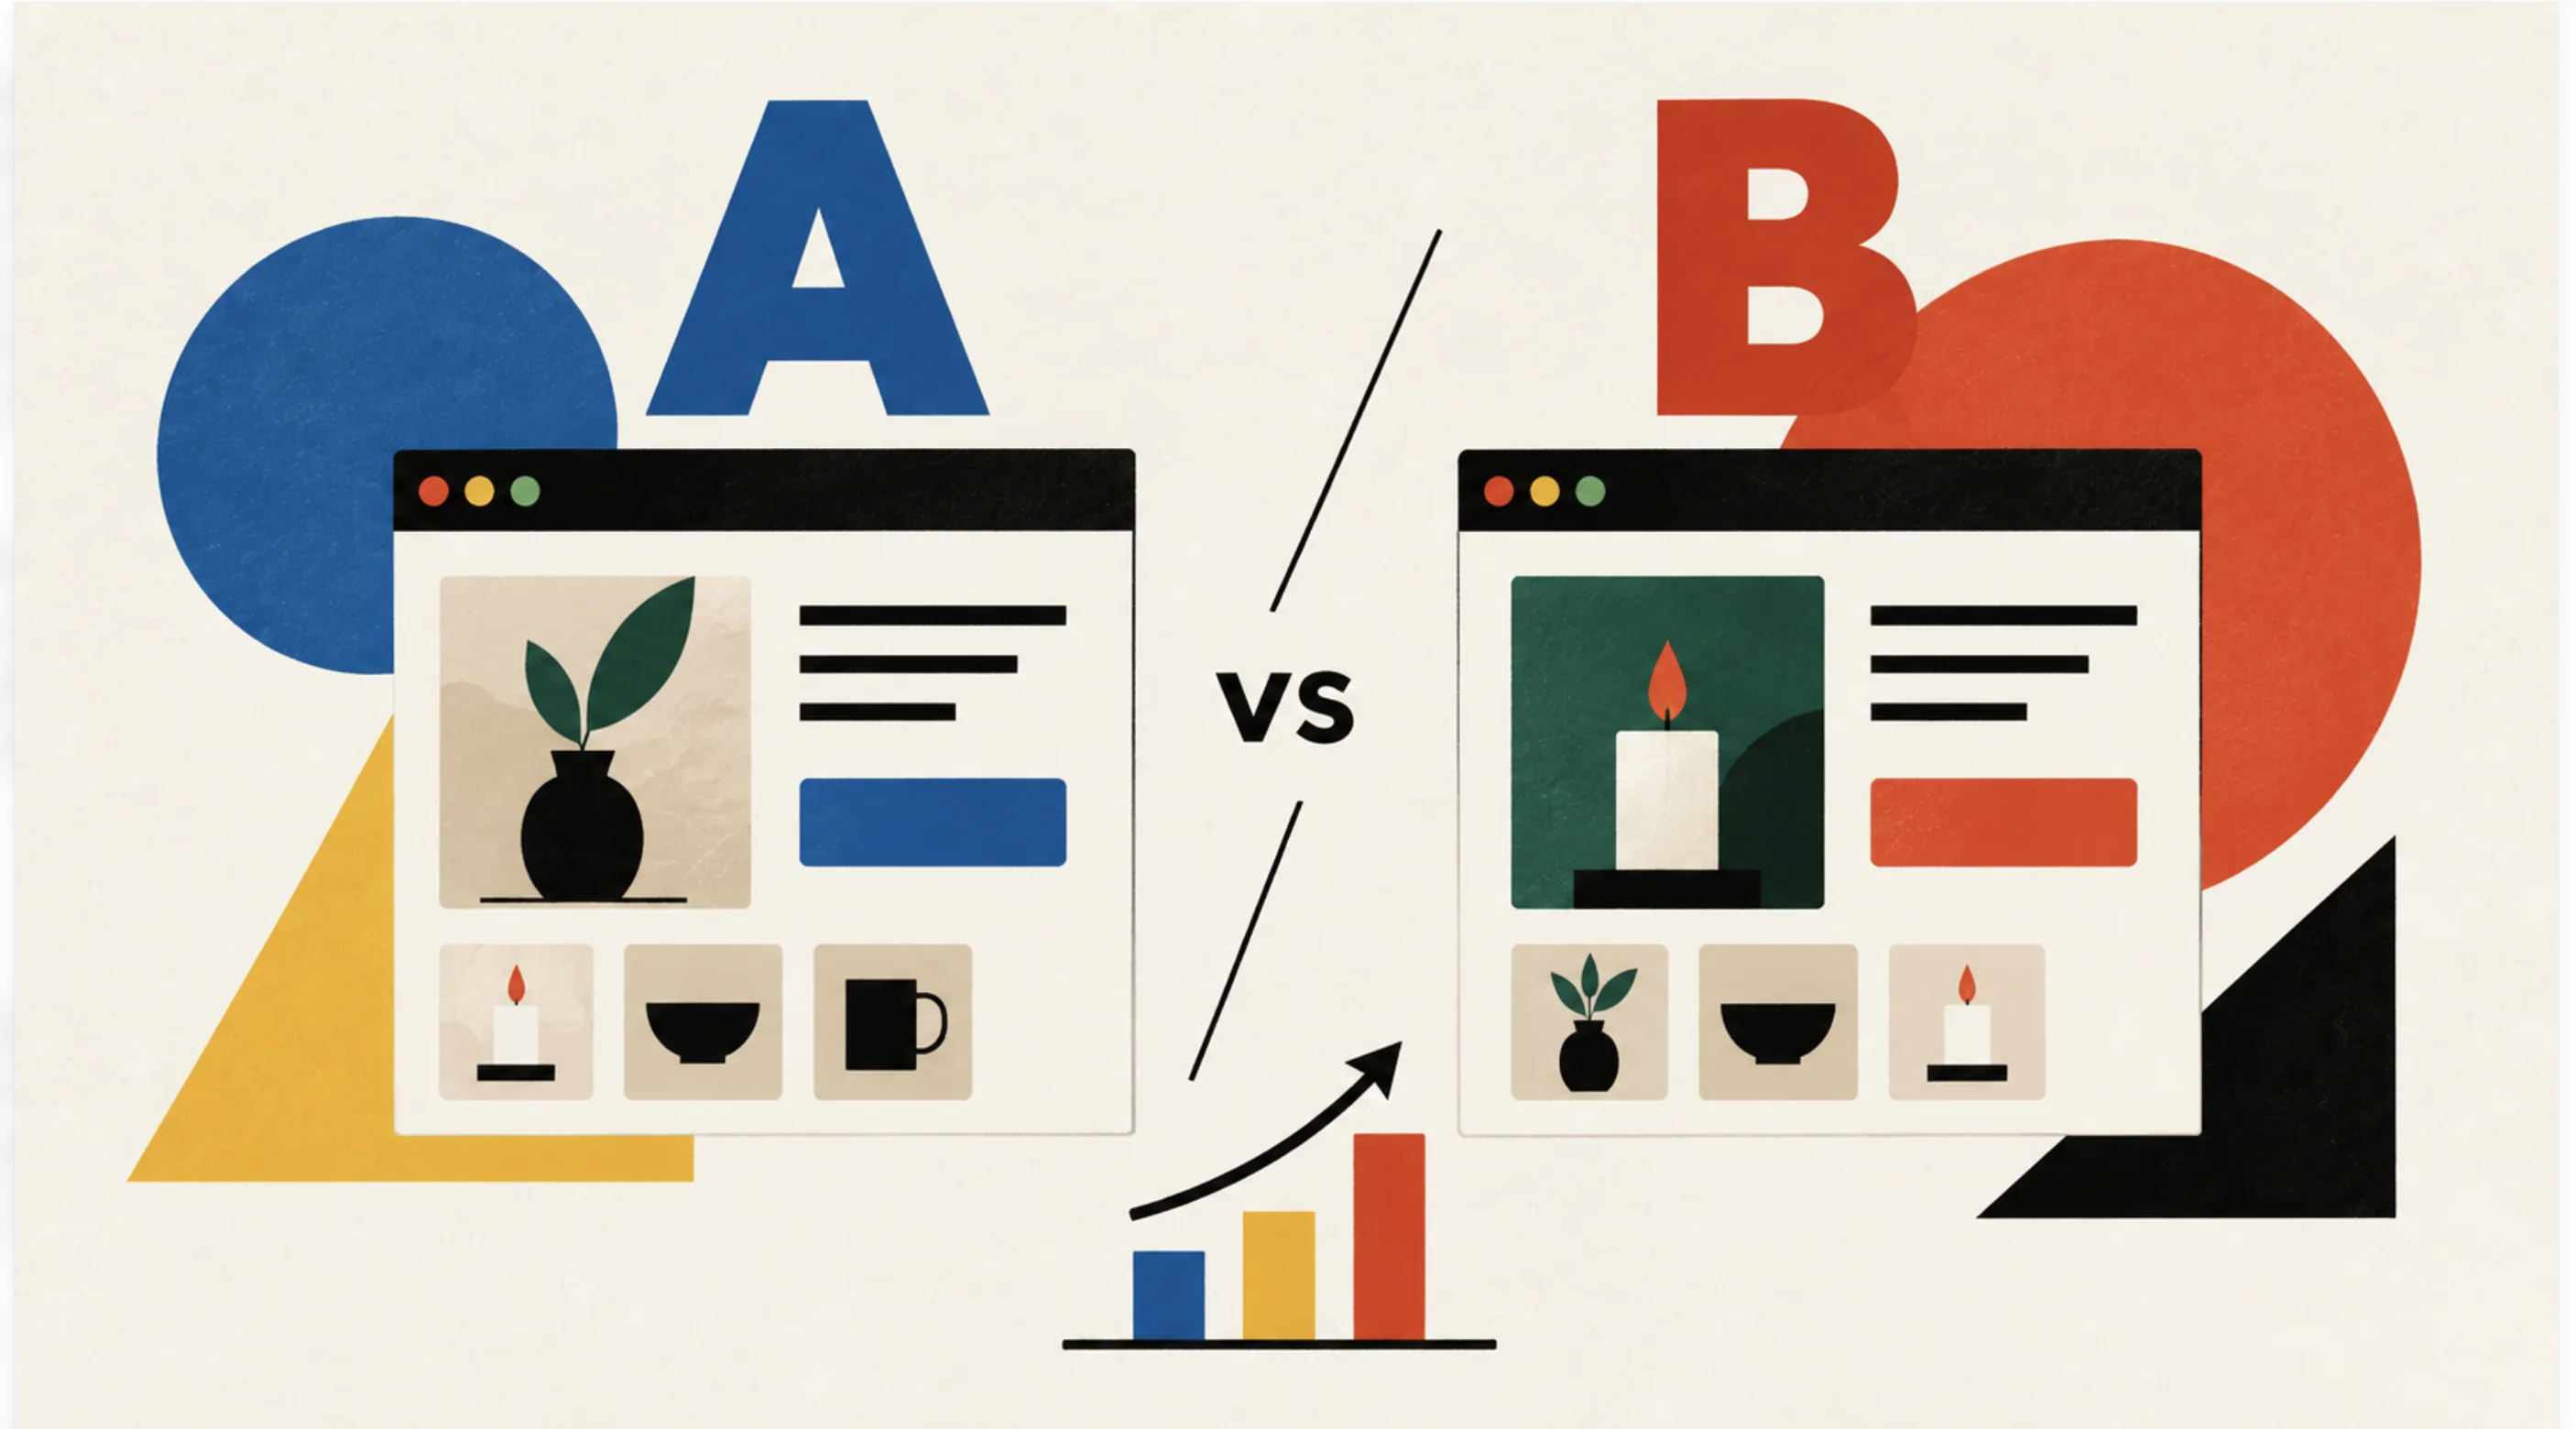
A/B Testing
How to design an experiment and tell whether a change really made things better.
 Inference
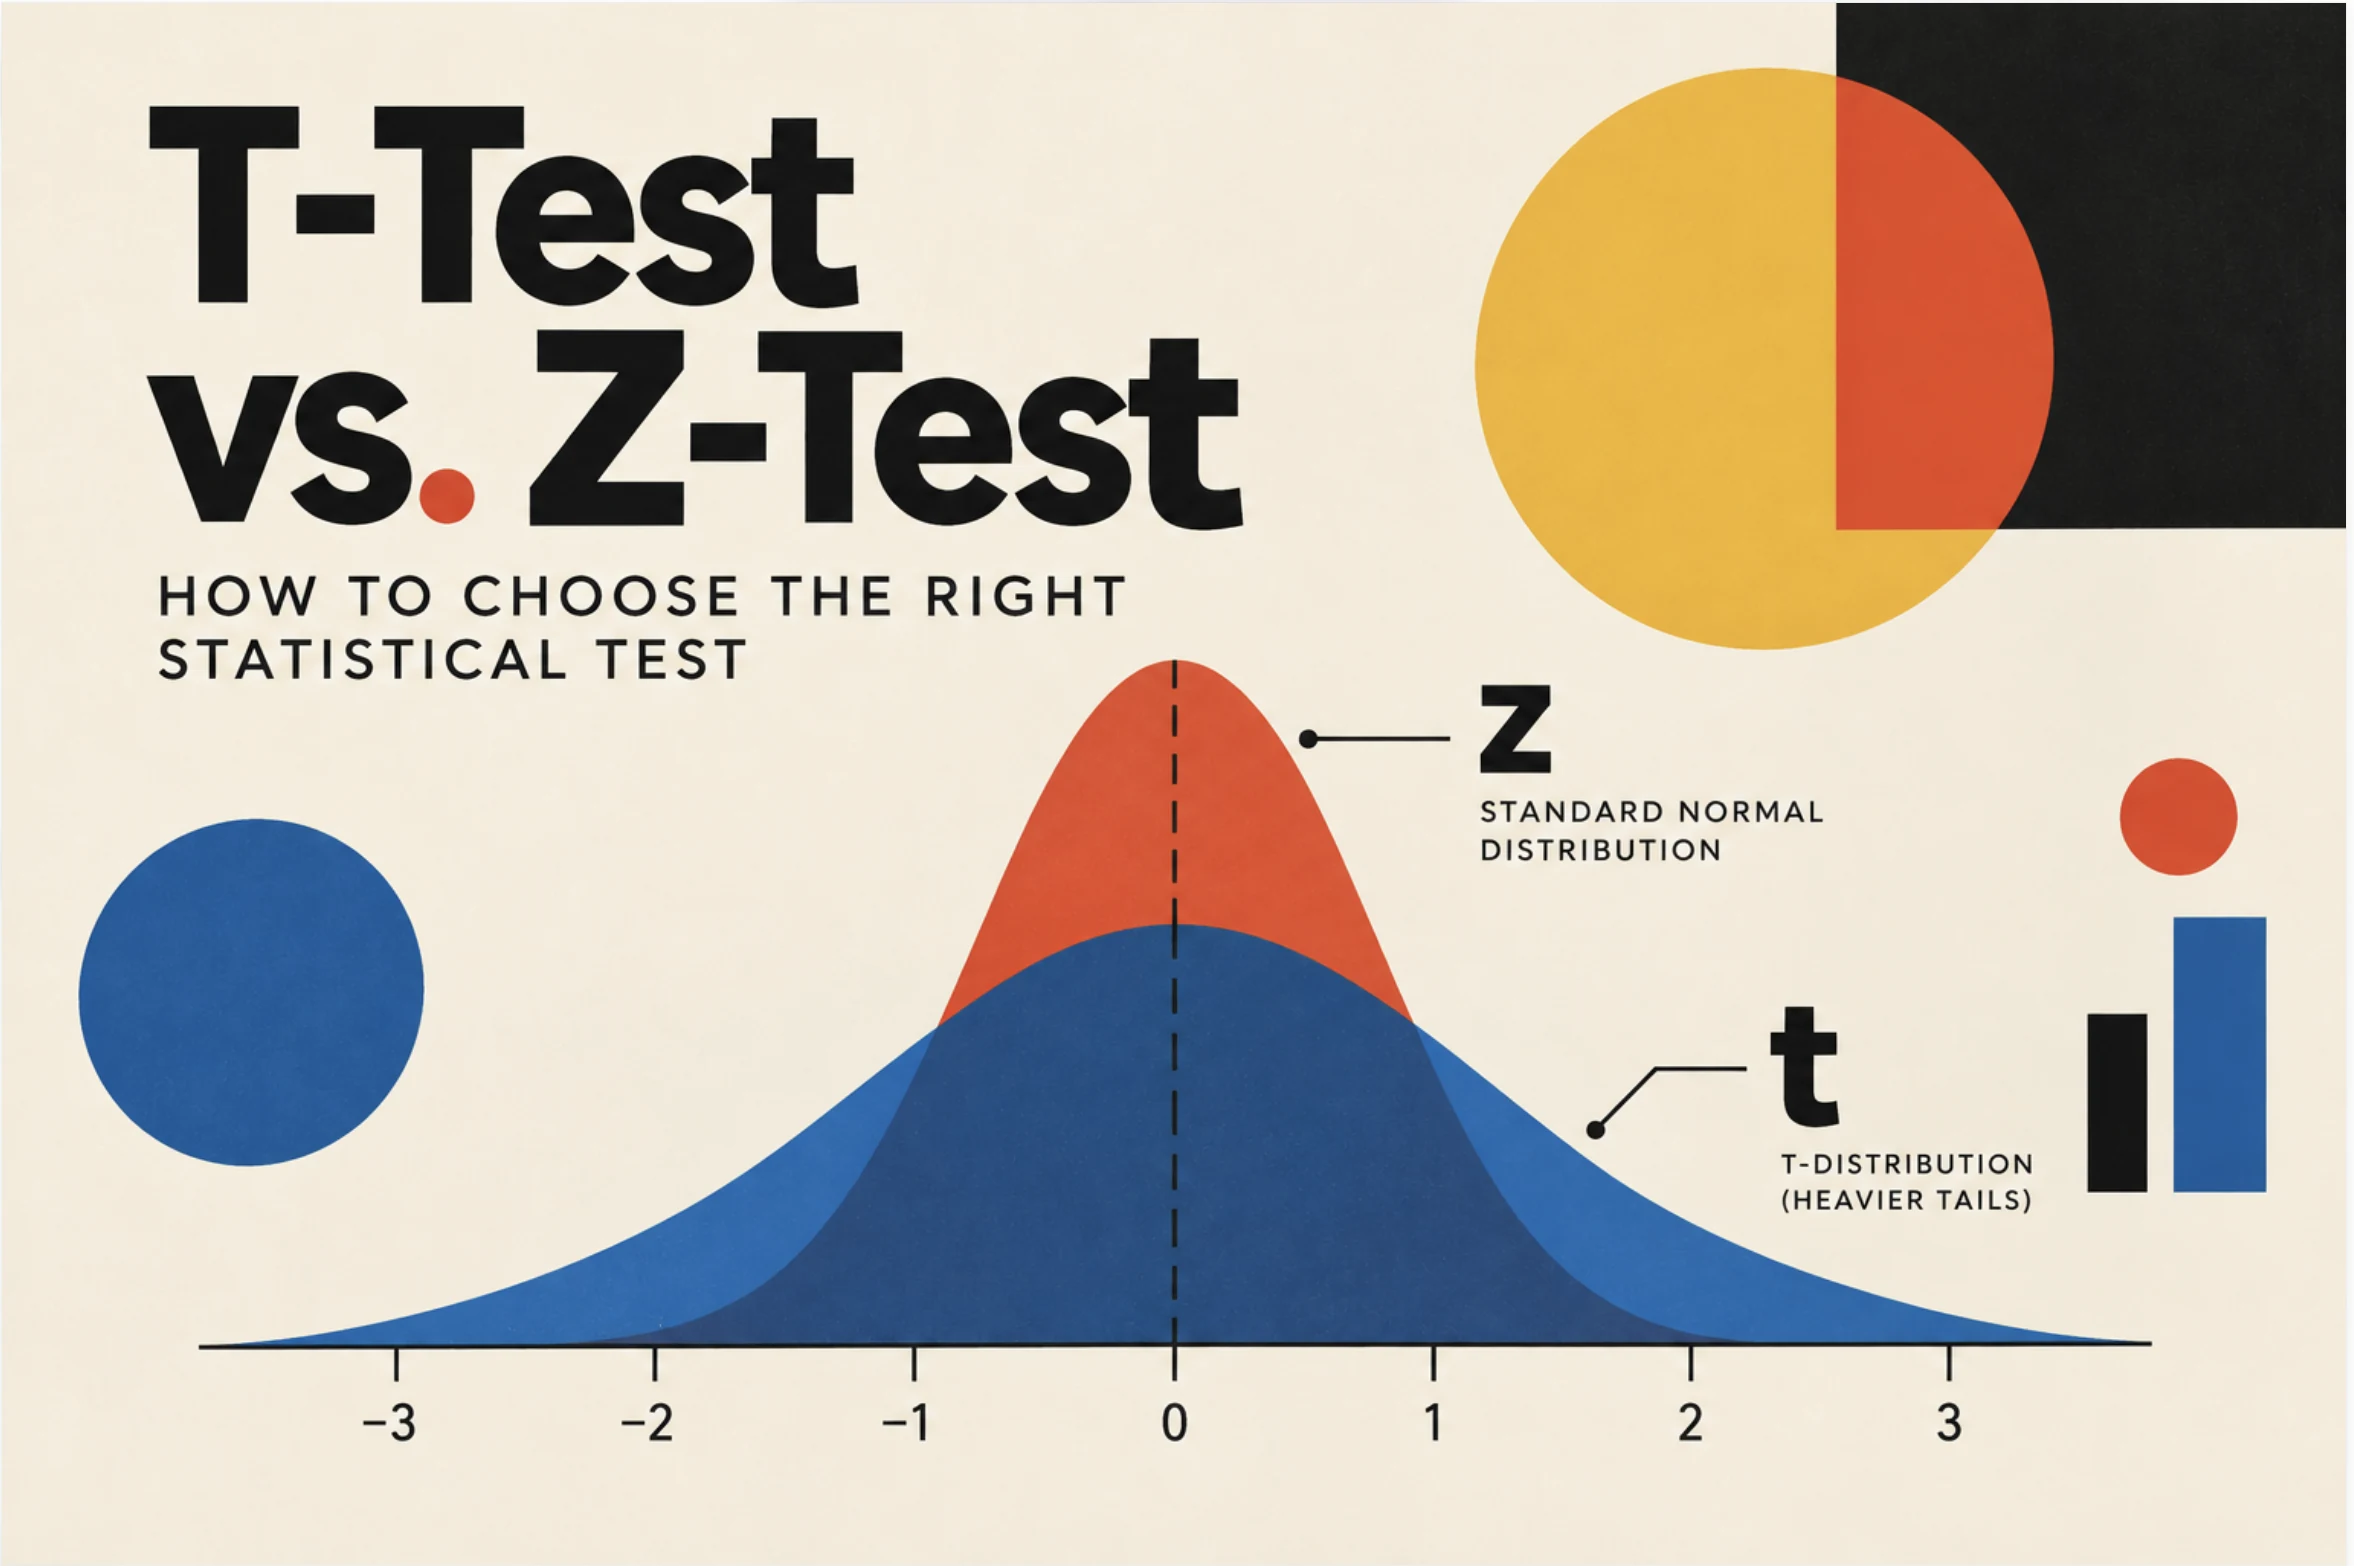
T-Test vs. Z-Test
How to choose the right test for averages and conversion rates with a simple decision tree.
Regression analysis
Model how an outcome depends on other variables, whatever type of outcome it is.
 Regression analysis
Simple Linear Regression
Predict sales from advertising spend and learn what the intercept and slope of a fitted line really mean.
 Regression analysis
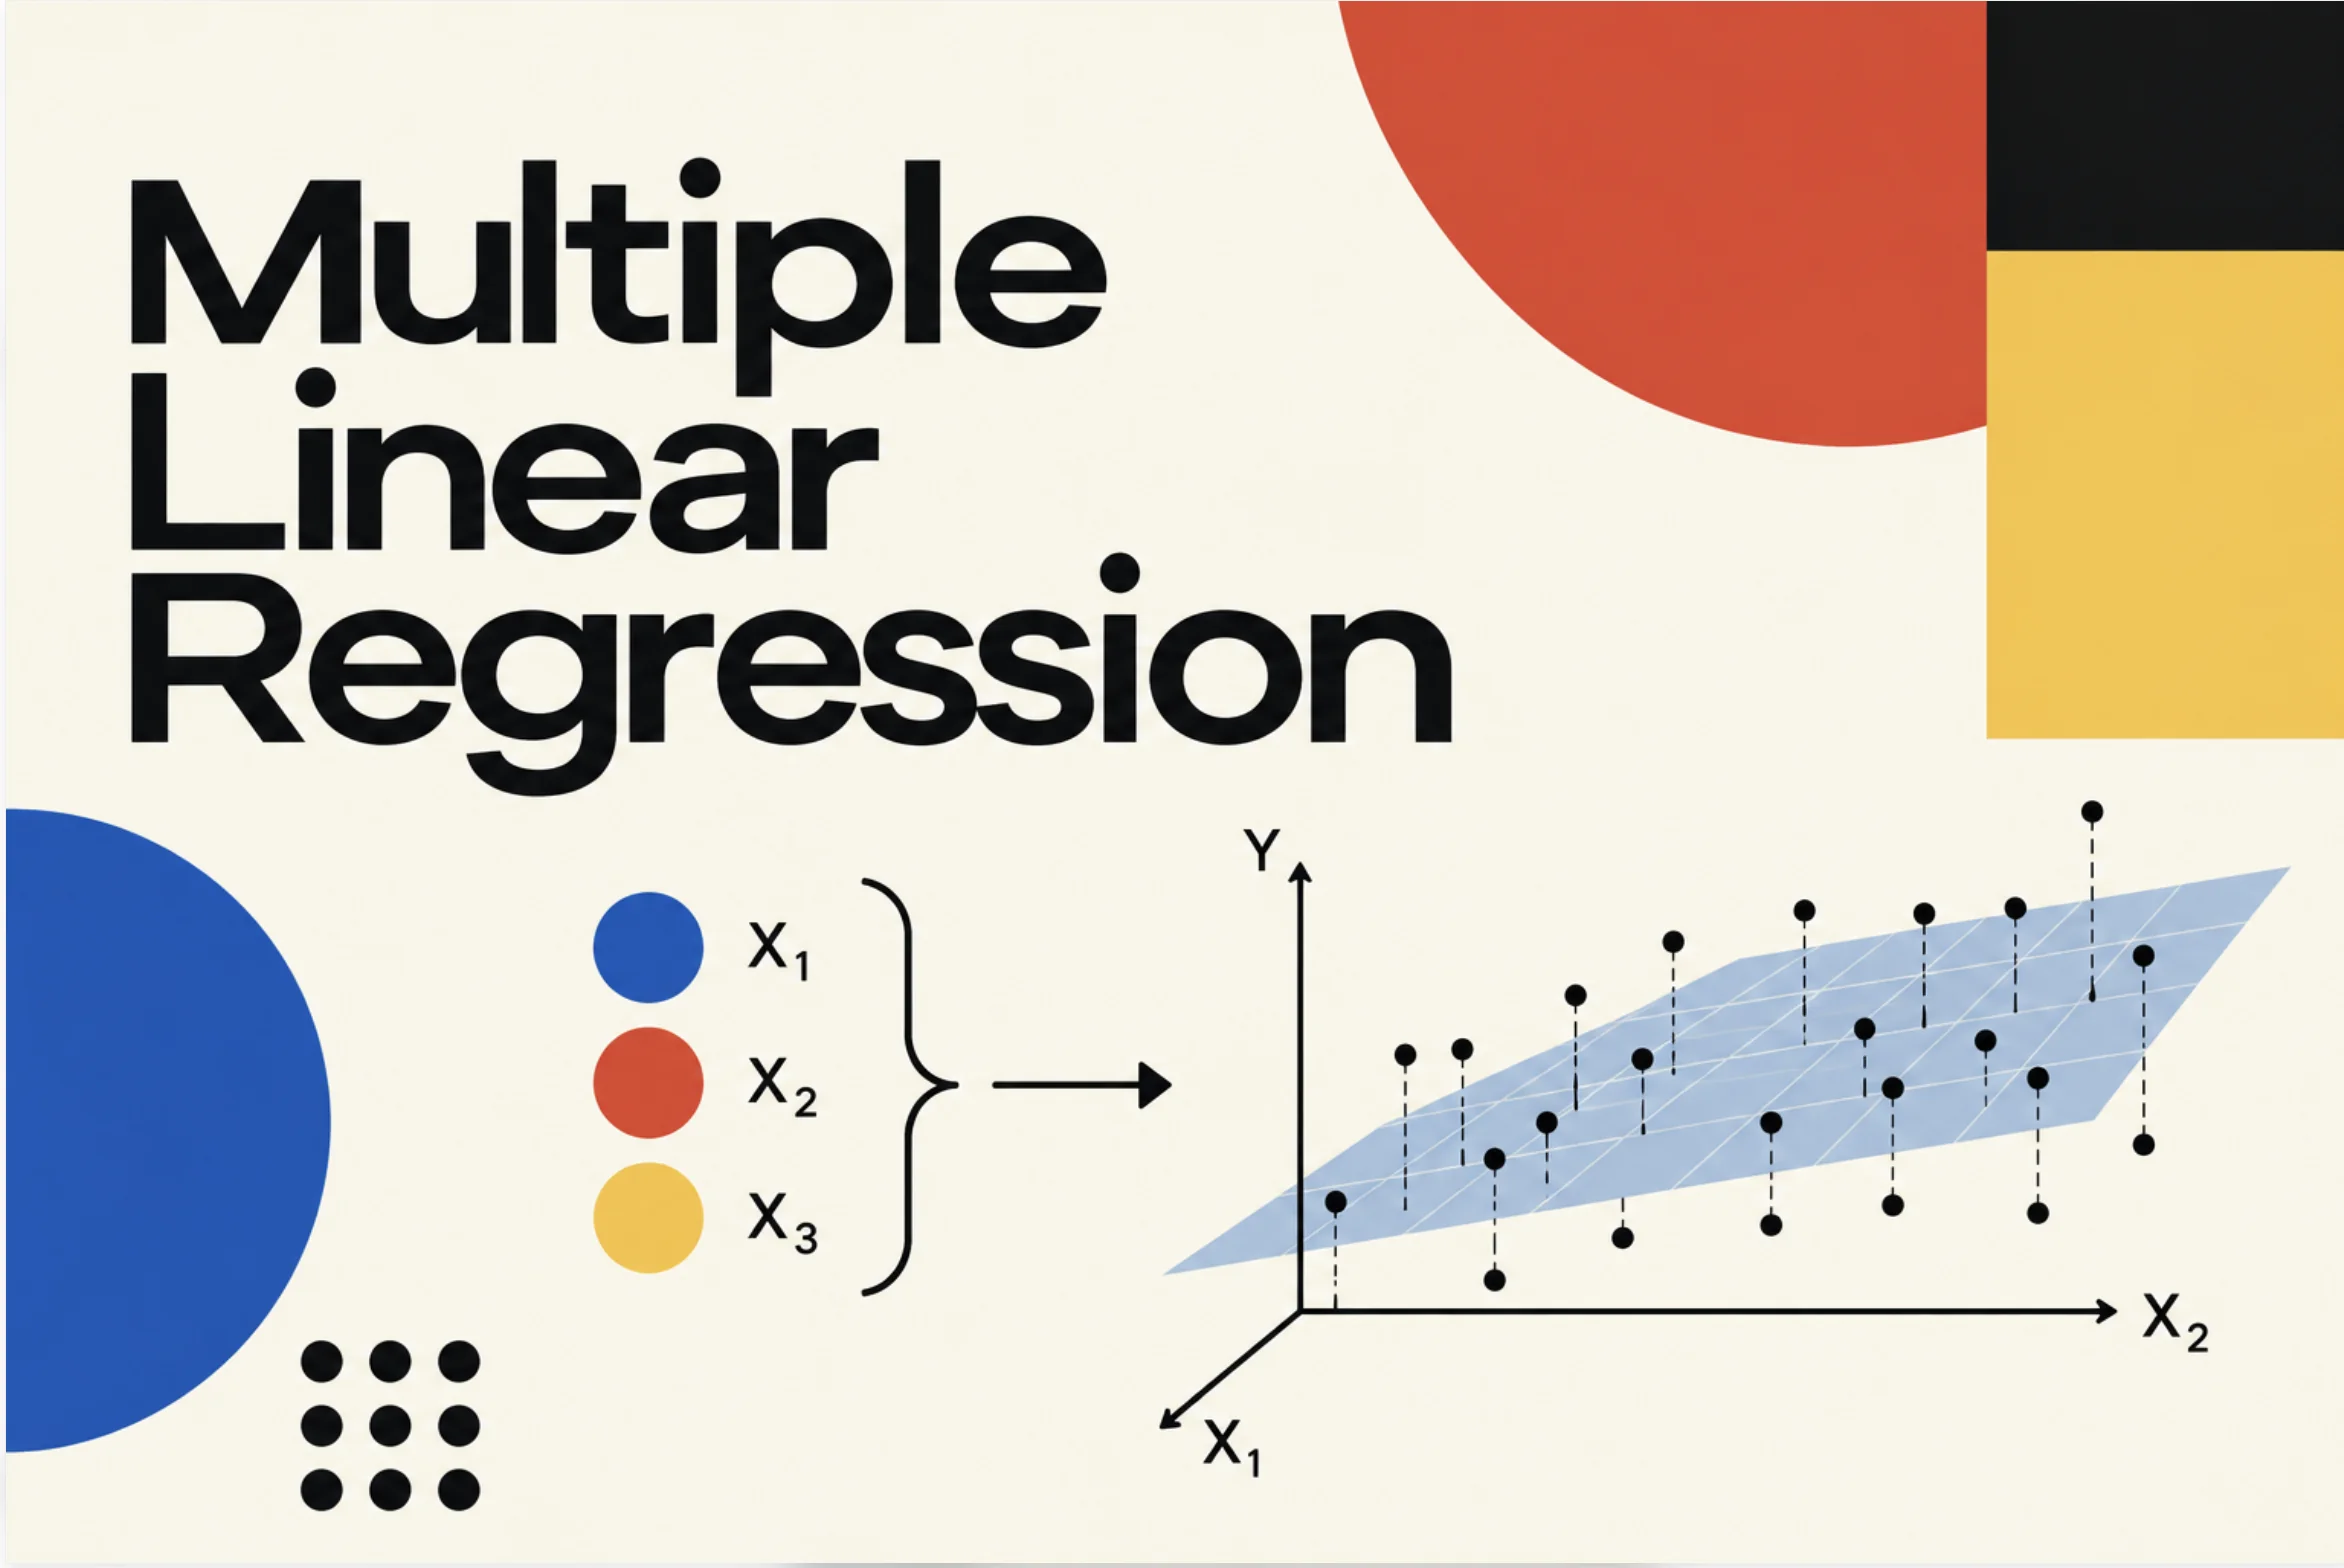
Multiple Linear Regression
Predict a customer's net revenue from several drivers at once, and learn to read each coefficient on its own.
 Regression analysis
OLS: Finding the Best-Fit Line
How residuals and the sum of squared residuals turn "fits well" into a number, and how OLS finds the best line.
 Regression analysis
The Four Assumptions of Simple Linear Regression
When can you trust a fitted line? Linearity, independence, normality and constant variance, and how to check them.
 Regression analysis
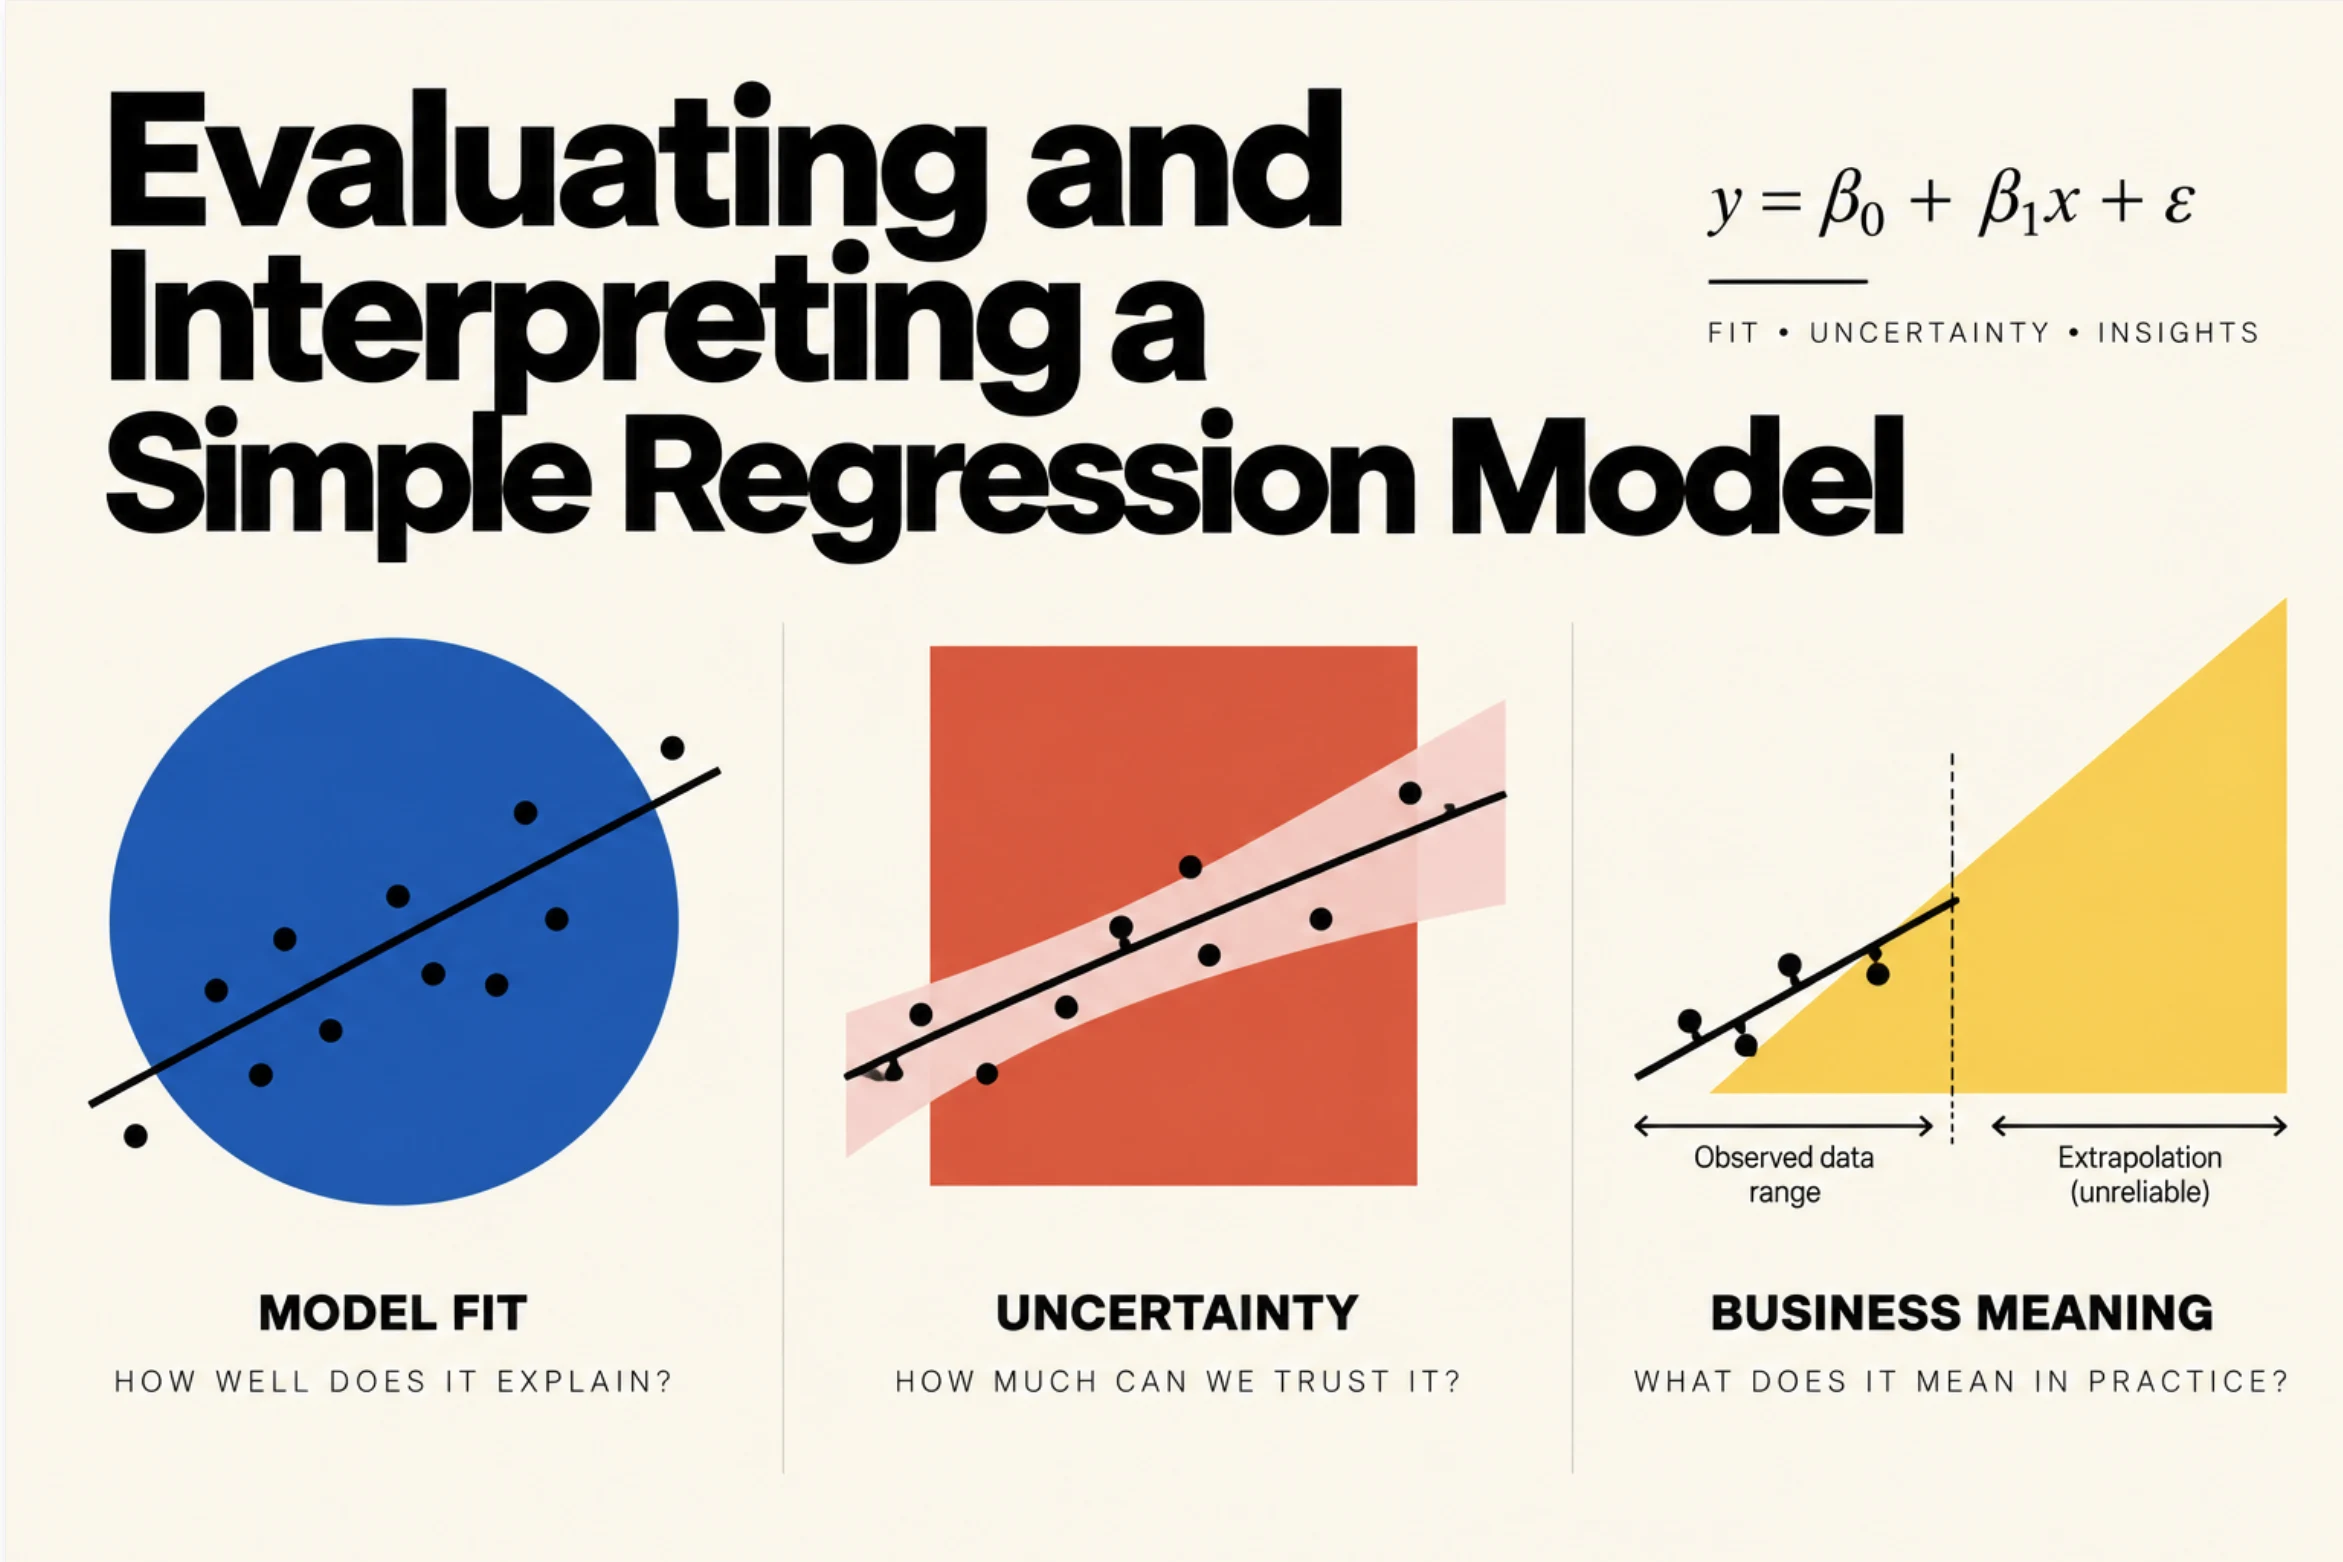
Evaluating and Interpreting a Regression Model
How well does the model fit and how reliable are its estimates? R², error metrics, p-values and confidence intervals.
 Regression analysis
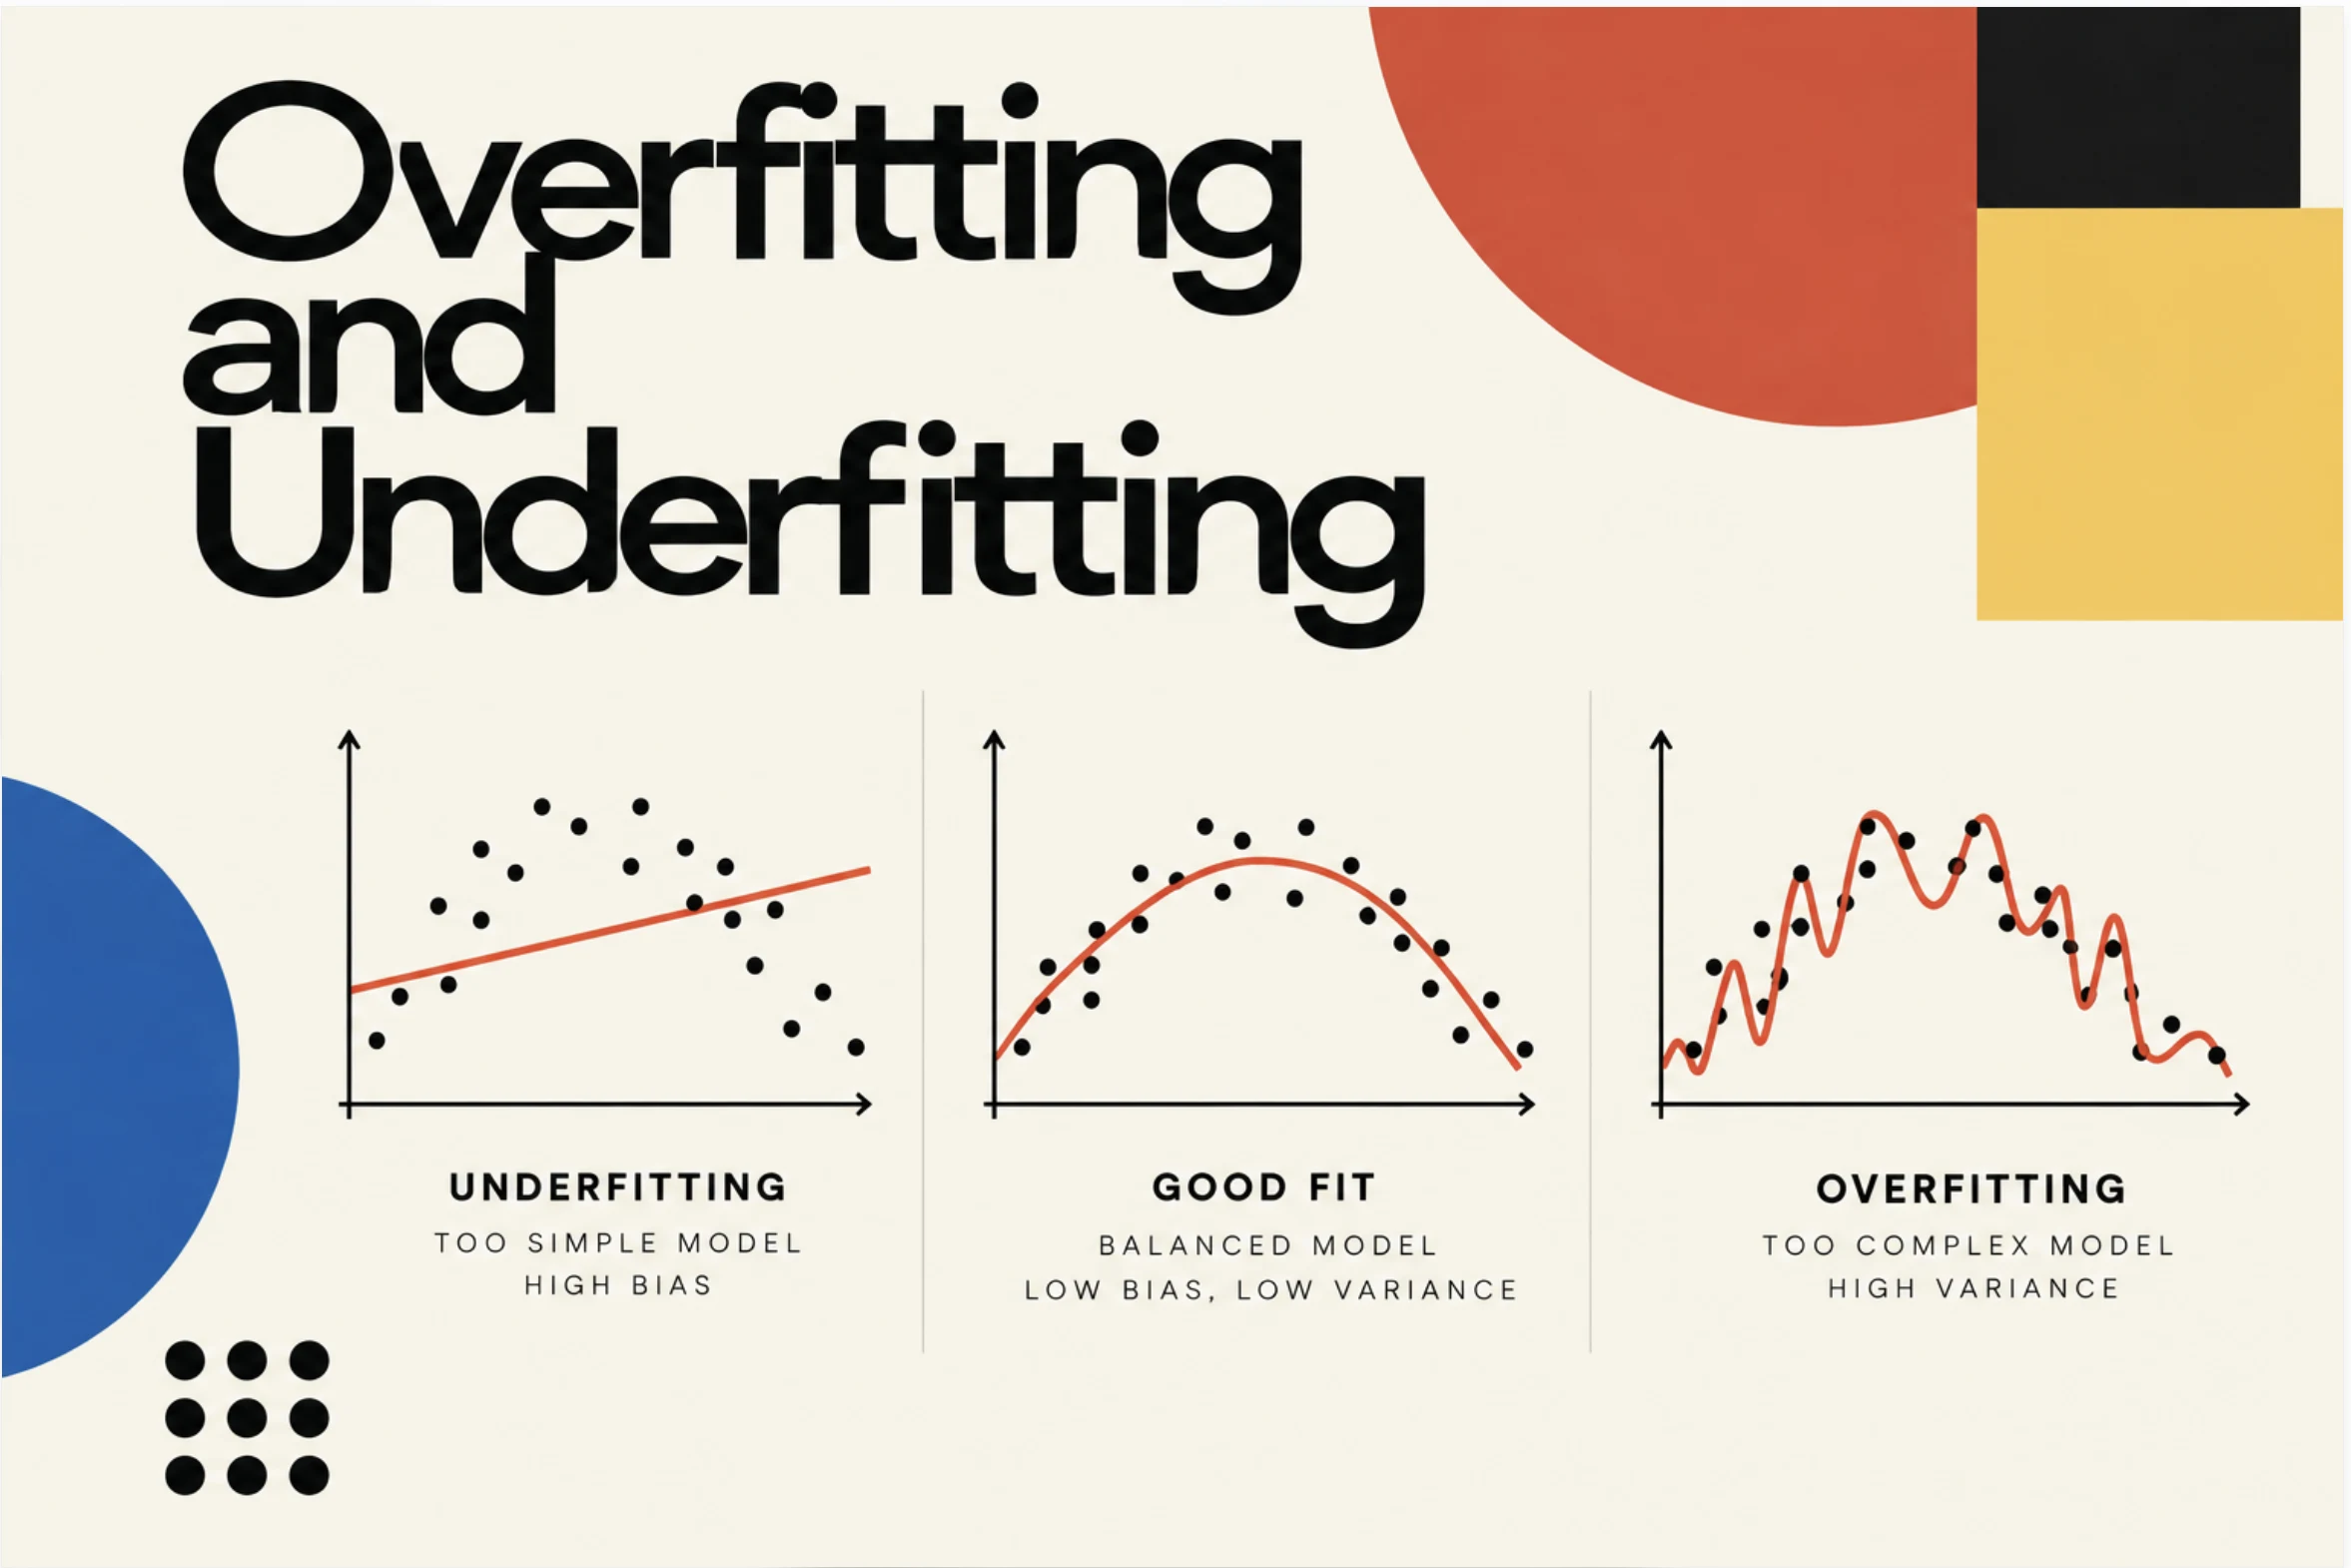
Overfitting and Underfitting
Why a model can be too simple or too flexible, and how to tell the difference before it fails on new data.
 Regression analysis
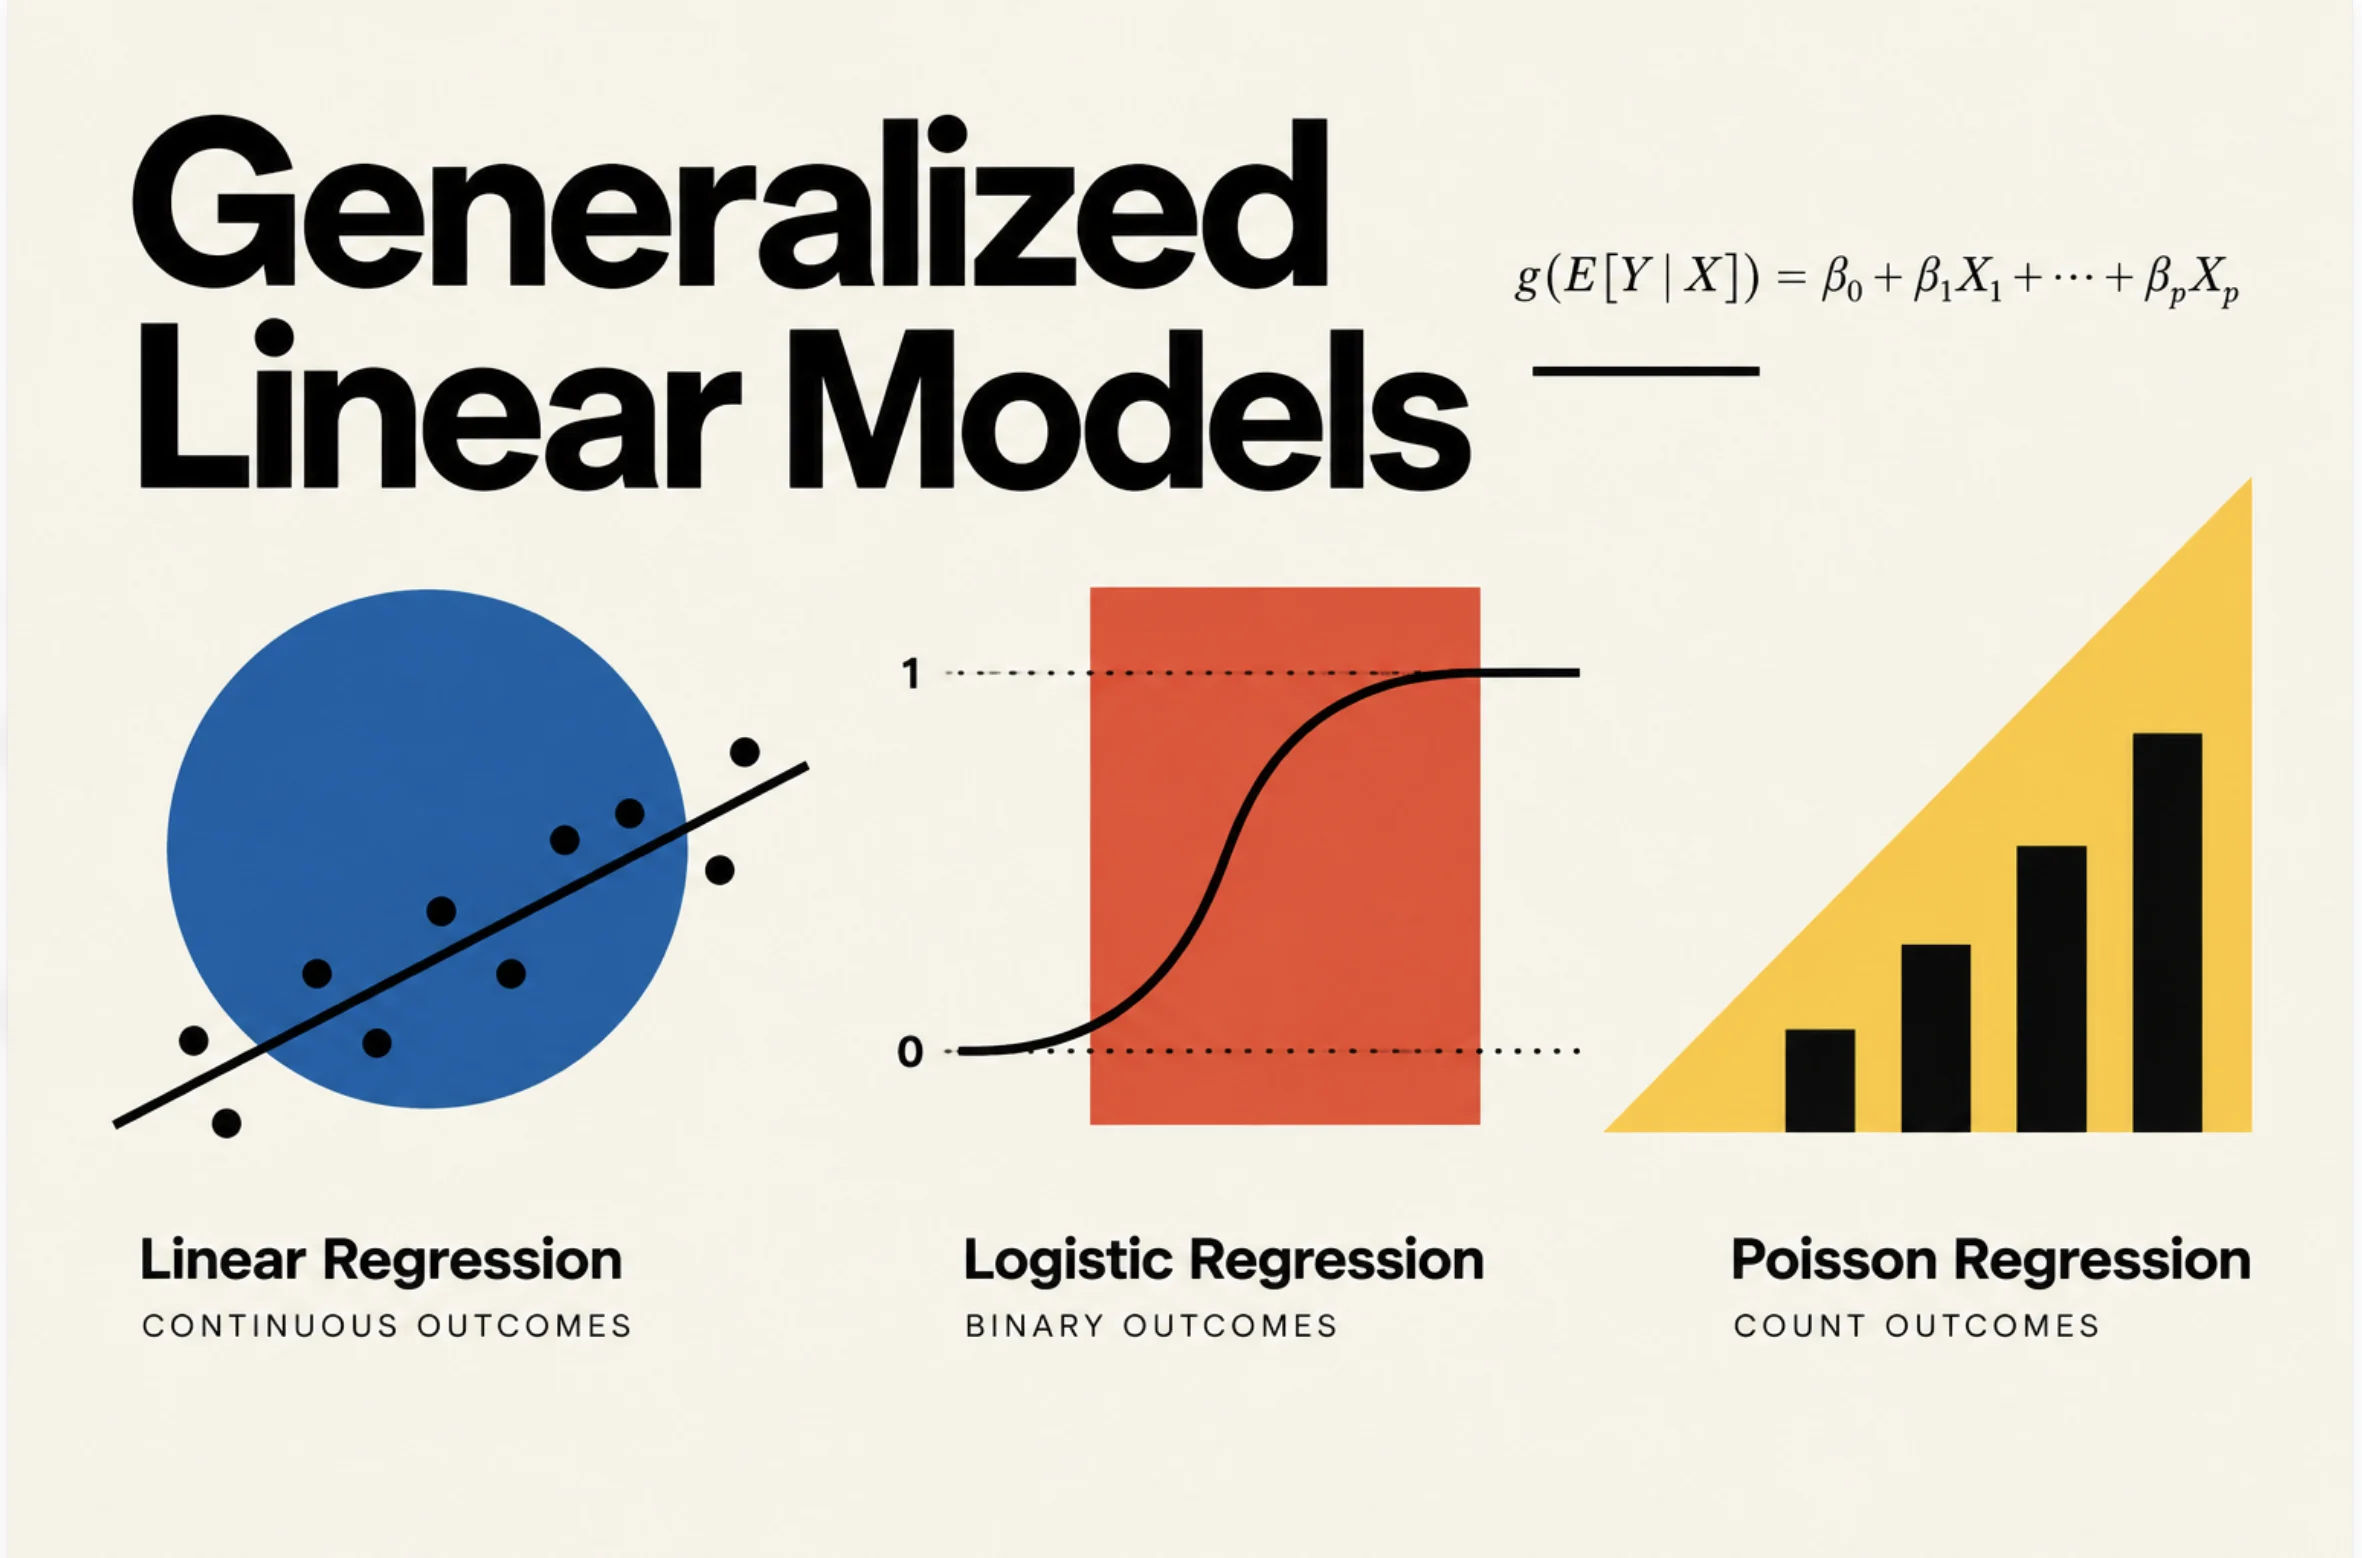
Generalized Linear Models
One framework behind linear, logistic and Poisson regression: link functions for continuous, binary and count outcomes.